
HIGHS LOWS AEGIS
Chỉ báo
1 lượt mua
Phiên bản 1.0, Dec 2025
Windows, Mac
5.0
Đánh giá: 2
Mô tả
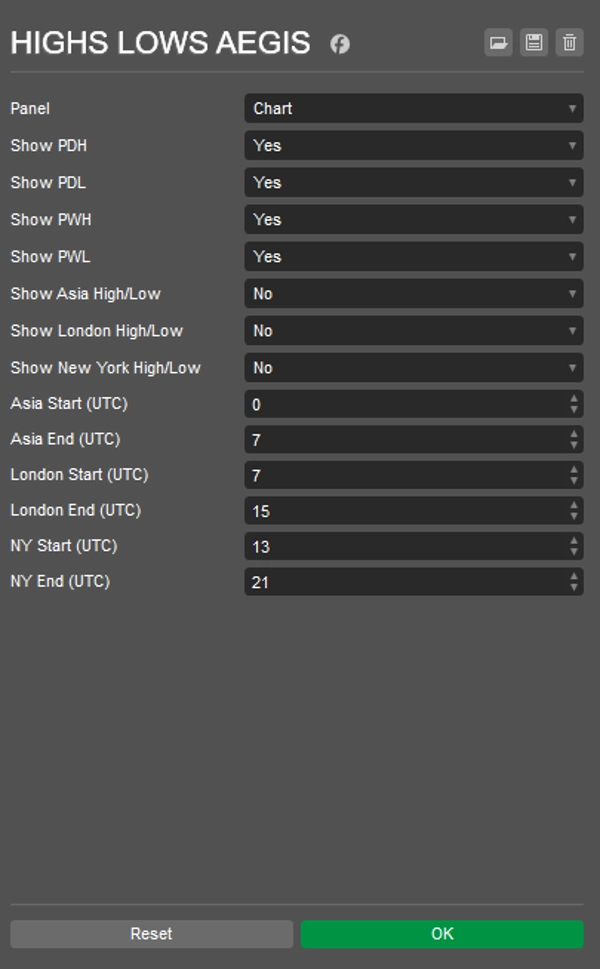
Chỉ báo đơn giản hiển thị các mức Cao và Thấp đã chọn.
- Thấp/Cao của Ngày Trước
- Thấp/Cao của Tuần Trước
- Phiên Á/ London/ New York Thấp/Cao
- Thời gian UTC tùy chỉnh cho mỗi phiên bắt đầu/kết thúc
Các đường có nhãn để dễ dàng nhận biết hơn.
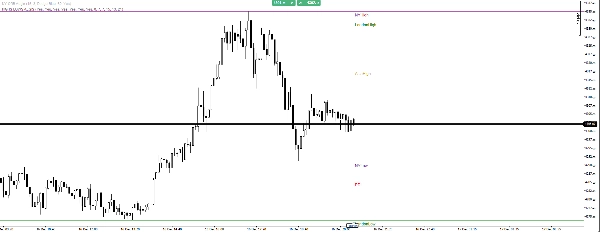
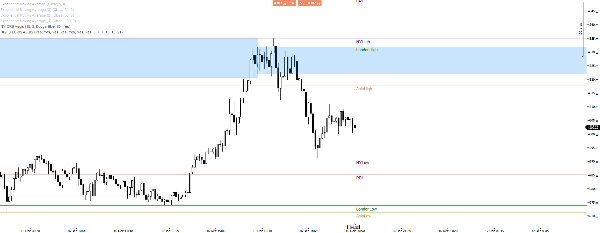
Sử dụng tốt với hầu hết các chiến lược, tôi dùng nó với ORB, điều này rất giúp tránh các phá vỡ giả, như trong hình hôm nay với XAUUSD.
Tóm tắt
Hồ sơ chỉ báo
Đánh giá của khách hàng
5.0
Đánh giá: 2
5 | 100 % | |
4 | 0 % | |
3 | 0 % | |
2 | 0 % | |
1 | 0 % |
Đánh giá của khách hàng
December 27, 2025
December 24, 2025
weak ideas are easier to skip, but it should stay in the support stack.
Thảo luận
Câu hỏi thường gặp
Prop
Forex
Breakout
Scalping
Indices
EURUSD
Commodities
SMC
Stocks
XAUUSD
NAS100
Các sản phẩm có sẵn trên cTrader Store, bao gồm bot giao dịch, chỉ báo và plugin, được cung cấp bởi các nhà phát triển bên thứ ba và chỉ nhằm mục đích cung cấp thông tin và tiếp cận kỹ thuật. cTrader Store không phải là nhà môi giới và không cung cấp lời khuyên đầu tư, khuyến nghị cá nhân hay bất kỳ đảm bảo nào về hiệu suất trong tương lai.


Giá
Kể từ 14/04/2025
1
Lượt bán