

Mô tả
Những người tham gia giao dịch đều biết tầm quan trọng của việc xem xét phiên trước đó.
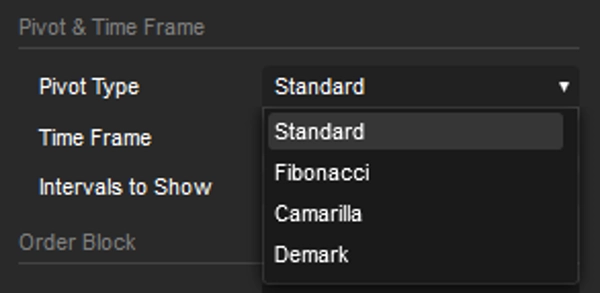
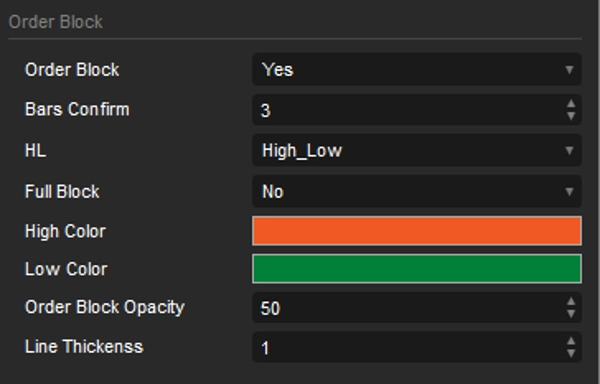
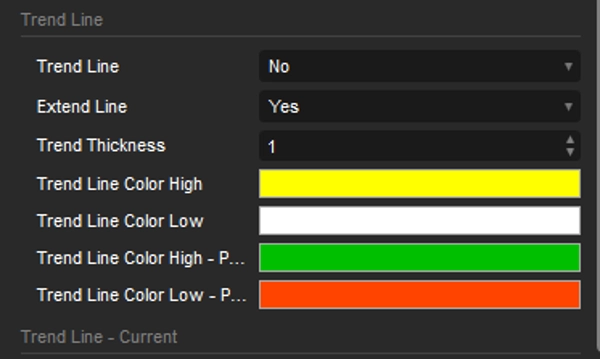
Tôi đã chuẩn bị chỉ báo Pivot này, với các khoảng thời gian từ 15 phút đến một tháng, và nó bao gồm các khối lệnh và các đường xu hướng. Cả hai tùy chọn đều dựa trên điểm cao nhất và thấp nhất của phiên trước đó.
Cấu hình mặc định được đặt cho khung thời gian 5 phút.
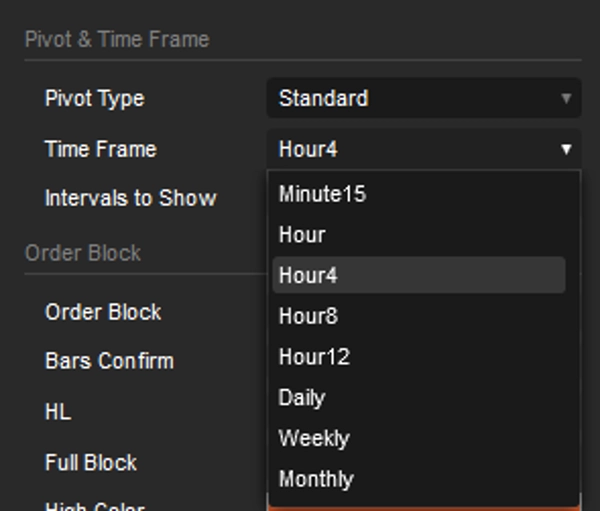
Pivot được đặt ở 4 giờ, và khoảng thời gian là 5, có nghĩa là nó nhìn lại 20 giờ trong các khoảng 4 giờ. Điều này hoàn hảo cho những người giao dịch hàng ngày.
Tuy nhiên, nếu bạn là người yêu thích Swing Trading, bạn chỉ cần thay đổi khoảng thời gian Pivot; mọi thứ khác sẽ tự động điều chỉnh.
Các khối lệnh làm nổi bật các khu vực tiềm năng nơi giá có thể tìm thấy hỗ trợ hoặc kháng cự, cung cấp cái nhìn sâu sắc về khả năng đảo chiều hoặc tiếp tục xu hướng. Bằng cách kết hợp chúng với các đường xu hướng được tạo tự động cho khung thời gian đã chọn, các nhà giao dịch có thể xác định chính xác hơn hướng đi tiềm năng của giá và các điểm vào hoặc thoát lệnh có thể. Khả năng hình dung các đường xu hướng này trên nhiều khung thời gian cung cấp sự hiểu biết toàn diện hơn về cấu trúc thị trường.
Với các công cụ bổ sung như
OrderPrice V3 https://ctrader.com/products/397
NTMPICLL https://ctrader.com/products/327
Range Box Level https://ctrader.com/products/245
Or RangeBoxFibonacci https://ctrader.com/products/526
Market Session https://ctrader.com/products/94
MacdVolume https://ctrader.com/products/267
4MA https://ctrader.com/products/247
Bạn sẽ trở nên bất khả chiến bại
Chúc may mắn 😀
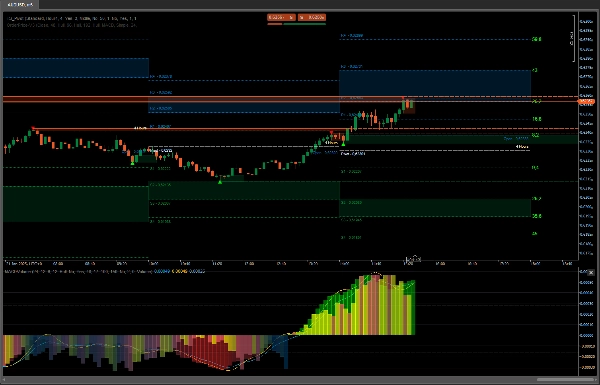
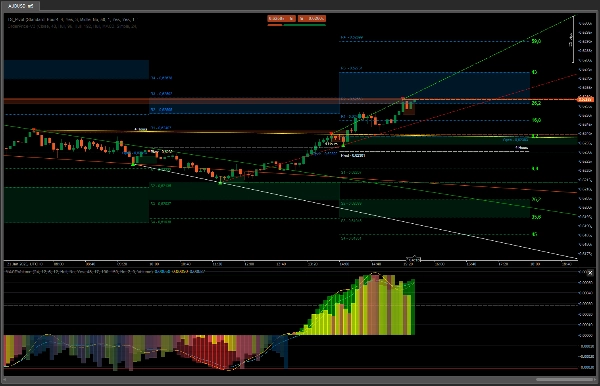
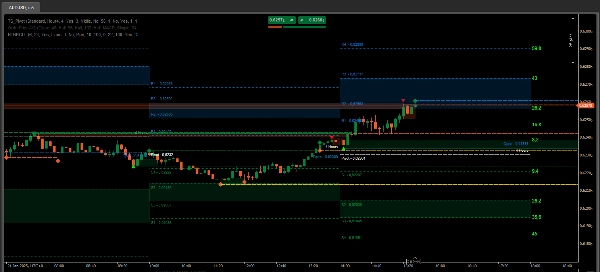
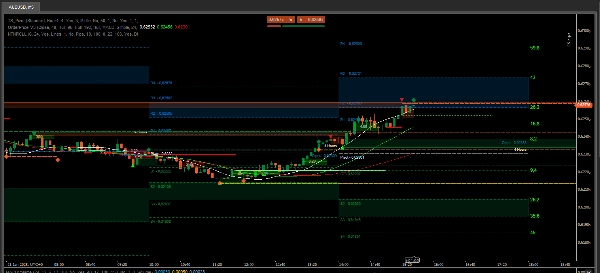
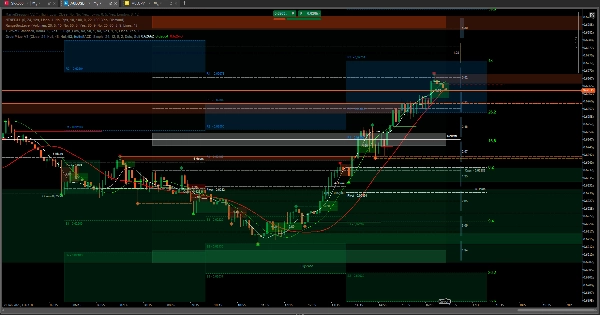
Trong trường hợp mua, quan sát hai hình ảnh cuối cùng hành vi của OrderPrice và các đường trung bình động được tích hợp, khi xuất hiện đường màu xanh lá và đường trung bình động nằm bên dưới, đó là thời điểm hoàn hảo để mở giao dịch mua.
Với dữ liệu từ phiên trước, bạn có thể xác định giá có thể đi xa đến đâu hoặc nơi có thể xảy ra kháng cự. Nếu nó phá vỡ, có thể tiếp tục đến điểm thứ hai, có thể là vùng trung tính của RangeBoxLevel. Nếu vượt qua điểm đó và không có dấu hiệu các đường trung bình động muốn thay đổi hướng, giá có thể đạt đến vùng khối lệnh của phiên trước đó.
Trong hình ảnh cuối cùng, có một ảnh chụp màn hình của tình huống hoàn hảo để vào và thoát giao dịch. Phần còn lại chỉ là quan sát và rút ra kết luận.
Những công cụ này rất cần thiết khi muốn chiến thắng trong giao dịch tài sản.
Tóm tắt
Key features include the integration of order blocks and trend lines derived from previous session data. Order blocks identify potential support and resistance zones, aiding in spotting possible price reversals or continuations. The indicator automatically generates trend lines for the selected timeframe, helping traders assess market structure and potential price direction. Visualizing these trend lines across multiple timeframes enhances market analysis.
TS_Pivot can be used alongside complementary tools such as OrderPrice V3, NTMPICLL, Range Box Level, RangeBoxFibonacci, Market Session, MacdVolume, and 4MA to refine entry and exit decisions. By combining moving averages and order block signals, traders can identify optimal moments to open buy or sell positions. The indicator supports various markets including Forex, cryptocurrencies, commodities, indices, and stocks.
Đánh giá của khách hàng
5 | 100 % | |
4 | 0 % | |
3 | 0 % | |
2 | 0 % | |
1 | 0 % |


![Logo "[CB] Pivot Points Pro"](https://cdn.ctrader.com/image/webp/43463c82-67b0-4f10-a4ba-901bba091d81_32594)


