Mô tả
Đây không phải là Chỉ báo Delta Khối lượng thông thường của bạn. Đây là Chỉ báo Delta Khối lượng DOM Cấp độ 2 — Dòng lệnh cấp độ tổ chức cho cTrader. Lợi thế mà các tổ chức trả hàng triệu đô la để có được.
Vấn đề mà mọi nhà giao dịch bán lẻ đều gặp phải. Một cây nến đóng cửa màu xanh. Khối lượng cao. Bạn mua.
Giá đảo chiều ngay lập tức. Bạn bị dừng lỗ. Biểu đồ đã "nói dối" bạn.
Nó không nói dối — bạn chỉ không thể thấy những gì đang xảy ra bên trong cây nến. Thanh màu xanh đó với khối lượng cao? 70% khối lượng đó là bán mạnh. Đóng cửa được nâng đỡ bởi một lớp mỏng các lệnh mua ở đáy phạm vi. Các tổ chức đang phân phối vào lệnh mua của bạn.
Các chỉ báo khối lượng tiêu chuẩn chỉ cho bạn tổng khối lượng. Chúng không bao giờ cho bạn thấy ai đang kiểm soát.
Delta Khối lượng thay đổi điều đó. Delta Khối lượng thực sự cho bạn thấy gì
Delta Khối lượng tách khối lượng của mỗi thanh thành khối lượng mua và khối lượng bán, sau đó tính toán sự khác biệt — delta. Delta dương có nghĩa là người mua tích cực hơn. Delta âm có nghĩa là người bán chiếm ưu thế.
Đây là thông tin quan trọng nhất phân biệt nhà giao dịch chuyên nghiệp với nhà giao dịch bán lẻ: không phải bao nhiêu được giao dịch, mà là bên nào giao dịch tích cực hơn. Đó là sự quyết tâm. Delta là dấu vân tay của ý định đằng sau mỗi thanh giá.
Nhưng không chỉ dừng lại ở đó
Chỉ báo này không đoán mò. Trong một hỗn hợp dữ liệu độc quyền, nó đọc dữ liệu Độ sâu Thị trường Cấp độ 2 — sổ lệnh thực sự nằm sau giá bạn thấy trên màn hình.
Dữ liệu Cấp độ 2 (còn gọi là DOM — Độ sâu Thị trường) cho thấy các lệnh mua và bán thực sự được xếp chồng ở mỗi mức giá. Không phải giao dịch cuối cùng. Không phải ước tính. Thanh khoản thực sự từ các ngân hàng, quỹ phòng hộ và các bàn giao dịch tổ chức chảy qua các nhà cung cấp thanh khoản của nhà môi giới bạn.
Kết quả là mức độ chính xác 85-95% trong việc phân loại khối lượng mua so với bán — vượt xa bất kỳ phép xấp xỉ dựa trên công thức nào có thể đạt được.
Tại sao điều này quan trọng — Những gì các tổ chức thấy mà bạn không thấy
Goldman Sachs, Citadel, Jump Trading — tất cả họ đều giao dịch với dữ liệu dòng lệnh. Họ thấy áp lực mua và bán trong thời gian thực. Họ thấy sự hấp thụ. Họ thấy khi một mức giá được bảo vệ. Họ thấy khi delta lệch so với giá.
Họ trả hàng triệu đô la cho cơ sở hạ tầng này. Các nguồn dữ liệu, các máy chủ đặt gần nhau, các công cụ độc quyền.
Chỉ báo này mang cùng khái niệm cốt lõi đó đến biểu đồ cTrader của bạn. Không phải phiên bản pha loãng. Dữ liệu DOM Cấp độ 2 thực sự từ nguồn thanh khoản của nhà môi giới bạn, được xử lý thành phân loại mua so với bán mà các nhà giao dịch dòng lệnh chuyên nghiệp sử dụng.
Sự khác biệt giữa nhà giao dịch bán lẻ và nhà giao dịch tổ chức không phải là trí thông minh. Mà là thông tin. Delta Khối lượng thu hẹp khoảng cách đó.
Dành cho ai
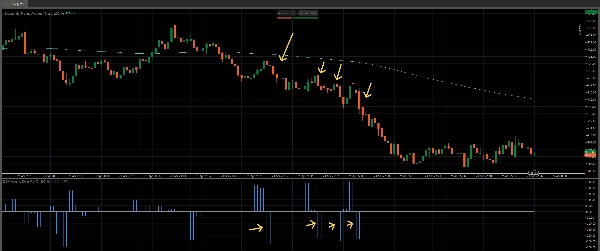
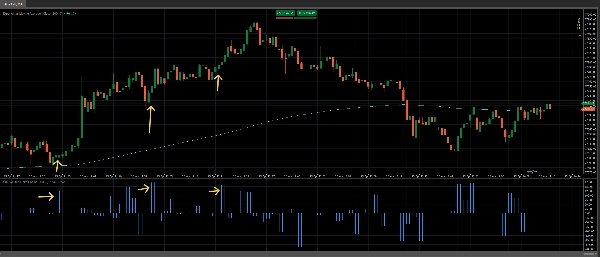
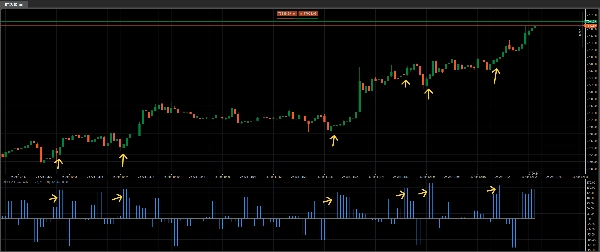
Nhà giao dịch trong ngày muốn nhìn xuyên qua tiếng ồn. Khi một cây nến trông có vẻ tăng nhưng delta âm, bạn biết phải chờ đợi. Khi một cây nến trông yếu nhưng delta rất dương, bạn biết các tổ chức đang tích lũy. Delta không nói dối — nó cho thấy những gì đã xảy ra, không phải những gì trông có vẻ như vậy.
Nhà giao dịch lướt sóng cần biết bên nào đang kiểm soát ngay bây giờ. Một đột biến delta trong một đột phá xác nhận đó là thật. Một đột phá với delta phẳng báo cho bạn biết đó là bẫy trước khi sự đảo chiều bắt đầu.
Nhà giao dịch swing muốn sự đồng thuận. Các phân kỳ delta — nơi giá tạo đáy mới nhưng delta tăng — là một trong những tín hiệu đảo chiều đáng tin cậy nhất trong giao dịch chuyên nghiệp. Chỉ báo này phát hiện chúng tự động.
Bất kỳ ai giao dịch forex, chỉ số hoặc hàng hóa trên cTrader với nhà môi giới cung cấp dữ liệu Cấp độ 2. Fusion Markets, IC Markets, Go Markets và các nhà môi giới ECN/STP tương tự đều cung cấp dữ liệu DOM mà chỉ báo này đọc.
Nếu bạn từng ở phía sai của một cây nến "khối lượng cao", đây là công cụ cho bạn biết lý do tại sao.
Bạn nhận được gì
Một biểu đồ thanh chuyên nghiệp, sạch sẽ bên dưới biểu đồ của bạn hiển thị delta ròng cho mỗi thanh, dựa trên dữ liệu cực kỳ chính xác. Thanh dương có nghĩa là người mua chiếm ưu thế. Thanh âm có nghĩa là người bán chiếm ưu thế. Kích thước thanh cho bạn thấy bao nhiêu một bên vượt trội hơn bên kia. Sử dụng cùng với các chỉ báo như 200 ema tạo sự đồng thuận và các thiết lập xác suất cao.
Không rối rắm. Không có các trung bình động khối lượng trễ. Không có nến màu "ước tính" mua và bán. Chỉ sự khác biệt thô, chưa lọc giữa mua tích cực và bán tích cực — được tính toán từ nguồn dữ liệu sâu nhất có sẵn cho nhà giao dịch bán lẻ.
Chỉ báo này cũng cung cấp tùy chọn sử dụng bộ lọc khối lượng để chỉ hiển thị các thanh quan trọng nhất. Tổng hợp các thanh khối lượng nếu muốn.
Chỉ cần nhìn một lần vào thanh delta cho bạn biết những gì mười chỉ báo khác cố gắng ước lượng. Hãy sở hữu ngay cho cTrader của bạn. Đây là một quyết định dễ dàng với mức giá thấp này.
Kết hợp với chỉ báo Volume Profile Pro của chúng tôi để có các quyết định thông minh hơn tại các mức quan trọng: https://ctrader.com/products/4079
Xem Bot Black Box tuyệt vời của chúng tôi tại đây: https://ctrader.com/products/3241
Tóm tắt
The indicator displays a clean histogram below the chart representing net volume delta per bar: positive bars indicate buyer dominance, negative bars indicate seller dominance, and bar size reflects the strength of that dominance. This provides traders with insight into market intent beyond total volume, revealing whether buyers or sellers controlled the price action.
It supports forex, indices, and commodities trading with brokers offering Level 2 data, such as Fusion Markets and IC Markets. Features include volume filtering and aggregated volume bars. The tool is suited for day traders, scalpers, and swing traders seeking to interpret order flow, confirm breakouts, detect divergences, and enhance decision-making with professional-level order flow data.
Đánh giá của khách hàng
5 | 50 % | |
4 | 50 % | |
3 | 0 % | |
2 | 0 % | |
1 | 0 % |