

MARCs_MARKET_OVERVIEW_PRO
Chỉ báo
Phiên bản 1.0, Aug 2026
Windows, Mac
Trading product for MARCs_MARKET_OVERVIEW_PRO Chỉ báo Key Levels RSI, image 2
Trading product for MARCs_MARKET_OVERVIEW_PRO Chỉ báo Key Levels RSI, image 3
Trading product for MARCs_MARKET_OVERVIEW_PRO Chỉ báo Key Levels RSI, image 4
Trading product for MARCs_MARKET_OVERVIEW_PRO Chỉ báo Key Levels RSI, image 5
Trading product for MARCs_MARKET_OVERVIEW_PRO Chỉ báo Key Levels RSI, image 6
Trading product for MARCs_MARKET_OVERVIEW_PRO Chỉ báo Key Levels RSI, image 7
Trading product for MARCs_MARKET_OVERVIEW_PRO Chỉ báo Key Levels RSI, image 8
Trading product for MARCs_MARKET_OVERVIEW_PRO Chỉ báo Key Levels RSI, image 9
Trading product for MARCs_MARKET_OVERVIEW_PRO Chỉ báo Key Levels RSI, image 10
Kể từ 24/06/2026

Mô tả

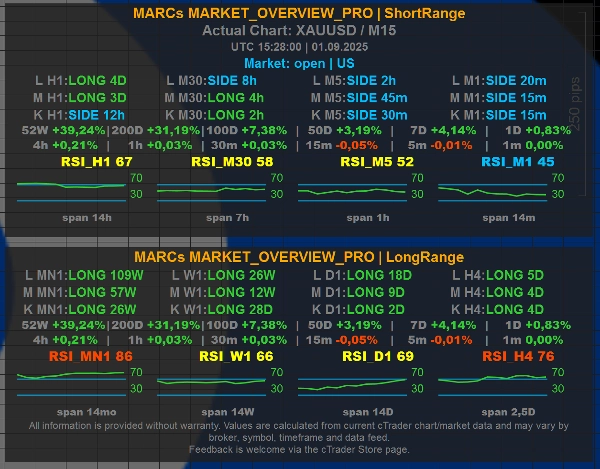
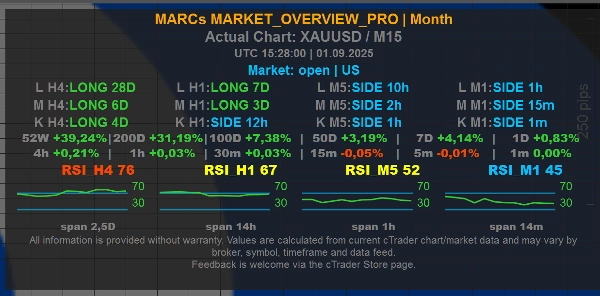
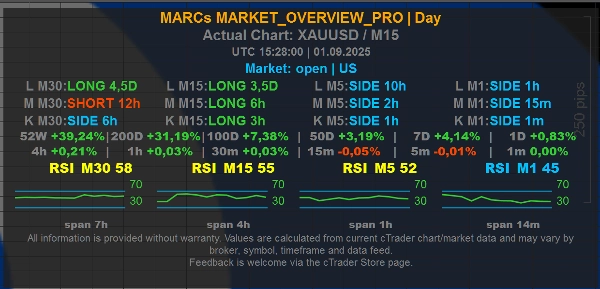
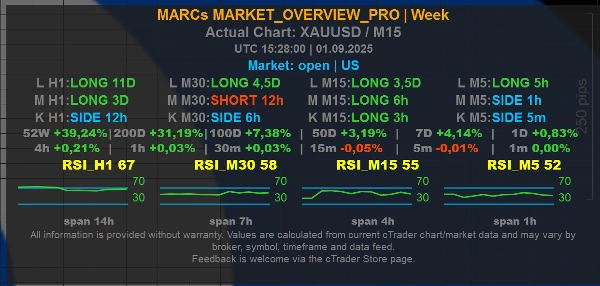
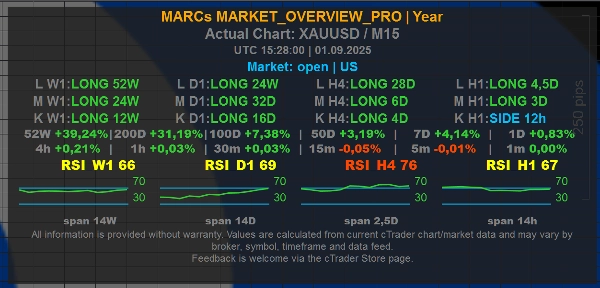
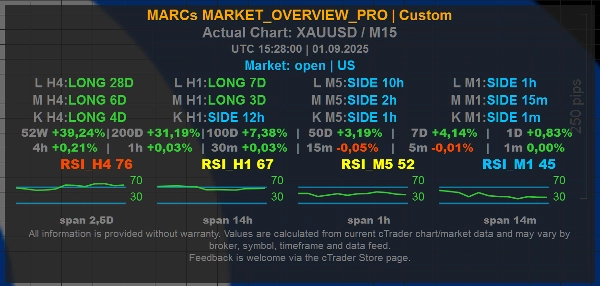
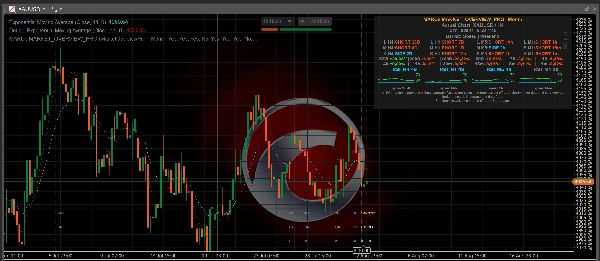
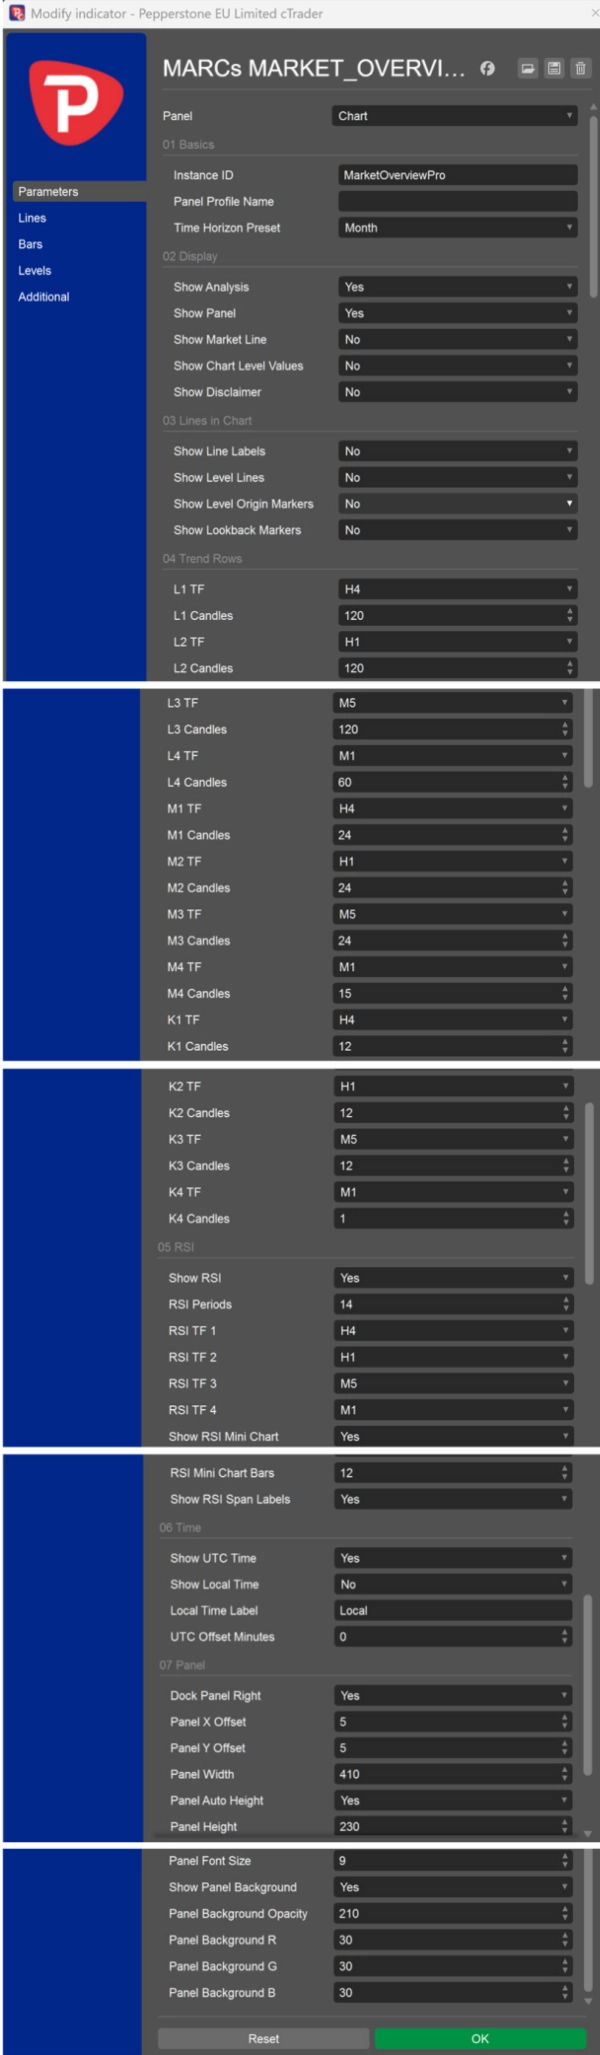
MARCs MARKET_OVERVIEW_Pro is a multi-timeframe market overview indicator for cTrader.


It displays a compact on-chart dashboard with trend context, RSI readings, market/session information and configurable time-horizon presets. The indicator was originally developed around XAUUSD / Gold analysis, but is designed to work as a general market overview tool on any available chart symbol, depending on broker data quality and available market history.


Main features:

- Multi-timeframe trend rows for short, medium and long market context

- Configurable Day, Week, Month, Year, ShortRange, LongRange and Custom presets

- RSI values and mini RSI charts across selected timeframes

- Optional UTC and local time display

- Optional market/session line

- Optional chart-level reference lines

- Optional chart-level values shown directly in the panel


Level Lines and Chart Level Values:

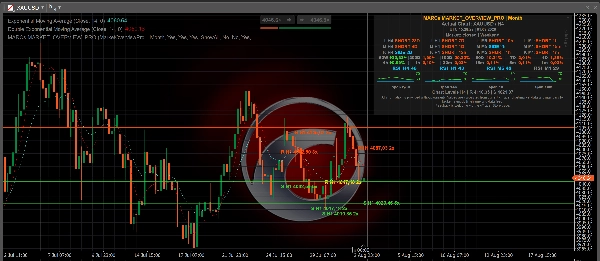
The optional Show Level Lines setting can display calculated chart reference levels from one selected timeframe: M1, M5, M15, M30, H1, H4, D1, W1 or MN1. For these individual timeframe selections, the indicator shows the nearest calculated resistance above the current price and the nearest calculated support below the current price. ShowAll displays the broader H1 level set from the existing H1 level calculation. No keeps level lines hidden.


The optional Show Chart Level Values setting can show the same nearest resistance/support reference values directly in the panel without drawing lines on the chart. The panel line is labelled, for example, "Chart Levels H1 | R ... | S ..." to make clear that the values refer to chart-level references.


How Level Lines are calculated:

The levels are derived from past swing highs and swing lows in the selected timeframe. Nearby swing points are grouped into level clusters, and only areas with enough repeated touches are shown. This makes the lines visual market-context markers based on available chart history.


Important:

MARCs Market Overview Pro is an analysis-only market overview tool. It does not place trades, manage positions, provide investment advice or guarantee trading results.


Level Lines are not buy signals, sell signals, stop-loss recommendations, take-profit recommendations or investment advice. They do not predict that price will reverse, break out or react at a specific level.


All readings depend on the available cTrader chart data, broker symbol feed, timeframe and market history. Values may differ between brokers, symbols and data feeds.


Trading involves risk. Past performance does not guarantee future results.

Tóm tắt

Hồ sơ chỉ báo
Danh mục chỉ báo
Cấu trúc thị trường (SMC)
Loại đầu ra
Hình ảnh trực quan
Bộ lọc
Yêu cầu dữ liệu
Chỉ dữ liệu nến
Tín hiệu được hỗ trợ
Sức mạnh xu hướng
Chạm ngưỡng

Đánh giá của khách hàng

0.0
Đánh giá: 0
Đánh giá của khách hàng
Sản phẩm này chưa có đánh giá nào. Bạn đã dùng thử chưa? Hãy là người đầu tiên chia sẻ với mọi người!

Thảo luận

Câu hỏi thường gặp

Key Levels
RSI
Market Structure
Risk Dashboard
Support & Resistance
Các sản phẩm có sẵn trên cTrader Store, bao gồm bot giao dịch, chỉ báo và plugin, được cung cấp bởi các nhà phát triển bên thứ ba và chỉ nhằm mục đích cung cấp thông tin và tiếp cận kỹ thuật. cTrader Store không phải là nhà môi giới và không cung cấp lời khuyên đầu tư, khuyến nghị cá nhân hay bất kỳ đảm bảo nào về hiệu suất trong tương lai.

Sản phẩm khác của tác giả này

Chỉ báo
RSI
Key Levels
+3
MARKs Free XAUUSD market overview dashboard with trend rows, RSI context, sessions and fixed Day/Month presets.
cBot
Conservative
Fixed Risk %
+5
MARCs GOLD H4-Gold-Swing-Bot for XAUUSD with transparent long-term backtests and optional reserve/guard system.
3.01
Hệ số lợi nhuận

Bạn cũng có thể thích

Chỉ báo
Prop
Forex
+10
IBS Indicator – Measures price position within bars for smarter trades. Works on all markets & timeframes.
Chỉ báo
RSI
Prop
+14
Unlock Stochastic RSI PRO in cTrader! Overlay RSI, highlight zones, and identify divergences with customizable settings.
Chỉ báo
MCDX is a powerful and innovative indicator.
Logo "ORB v1.1"
Phổ biến
4.0
(3)
$25
Chỉ báo
Breakout
Opening Range Breakout v1.1 - Visuals + Stats
Chỉ báo
AI
ATR
+26
Liquidity Cluster Order automatically detects and draws accumulation zones & distribution zones
Chỉ báo
SMC
Prop
+11
Sessions PRO is a professional session visualization indicator - 4 Fully Customizable Sessions
Chỉ báo
Forex
Indices
+1
Professional Fair Value Gaps with multitimeframe spot on
Chỉ báo
ATR
RSI
+3
🚀 Specialized algorithm is designed to confirm entry and exit points with precision 🎯
Chỉ báo
Forex
Crypto
+2
Market Structure Indicator – Your Trading Map in a Noisy Market. No more Panicking Which one, Where, Why and How.
Chỉ báo
BOS
CHOCH
+5
A professional-grade cTrader indicator for traders following the Inner Circle Trader (ICT) methodology. It replaces 6–8
Chỉ báo
VWAP
Volume
+5
Institutional Session VWAP + 3-Sigma Bands & HUD. Engineered for high-precision Index & Prop Firm Scalping.
Chỉ báo
ATR
Key Levels
+5
CPR indicator that actually predicts the day ahead: width percentile scoring for breakout-day detection
Chỉ báo
Prop
Forex
+10
Heatmap Pro analiza la volatilidad, el volumen y la acción del precio para "pintar" tu gráfico con zonas de color.
Chỉ báo
Prop
Forex
+12
⚡ ADXVMA Aurora Trend Filter combines ADX trend strength with an adaptive EMA blend ⚡
Chỉ báo
Forex
GBPUSD
+3
Support & resistance zones with measured hold rates and confidence intervals — evidence, not just lines on a chart.
Chỉ báo
Visually master the Inside Bar strategy with clear breakout signals and professional chart highlighting 📈🔔📉
Chỉ báo
Forex
BTCUSD
+4
The Linear Regression Oscillator (LRO) is a technical indicator based on linear regression analysis.
Chỉ báo
ATR
BOS
+5
Full ICT/SMC 4-step setup checker that alerts a long or short setup.

Giá

Kể từ 24/06/2026

















