

Descrição
A IDEIA
Um RSI que traduz seus níveis em preço e os plota diretamente no gráfico, mantendo o momentum e o preço no mesmo espaço em vez de em um painel separado.
O PROBLEMA
O RSI normalmente é lido em um painel separado.
Para usá-lo, você deve constantemente comparar o valor do oscilador com o que o preço está fazendo no gráfico principal.
Níveis como 70, 30 ou 50 são números em um oscilador. Eles não indicam onde o preço precisa estar para que o RSI os alcance.
Então você continua traduzindo visualmente: "O RSI está em 62 — onde isso está no gráfico?"
O problema não é o RSI em si.
O problema é que o momentum e o preço são mostrados em dois lugares diferentes, em duas unidades diferentes.
O CONCEITO CENTRAL: OS NÍVEIS DO RSI SE TORNAM NÍVEIS DE PREÇO.
O RSI tradicional pergunta:
"Qual é o valor do RSI agora?"
O RSI Overlay pergunta:
"A que preço o RSI alcançaria este nível?"
Cada nível do RSI é convertido no nível de preço correspondente e plotado diretamente no gráfico.
O oscilador não é mais algo que você lê em uma janela e traduz para outra.
Sua informação é expressa na mesma escala de preço do movimento que você já está analisando.
O RSI define o nível. O gráfico o mostra em preço.
O QUE ELE FAZ
O RSI Overlay converte referências selecionadas do RSI em níveis dinâmicos de preço e os exibe diretamente no gráfico principal.
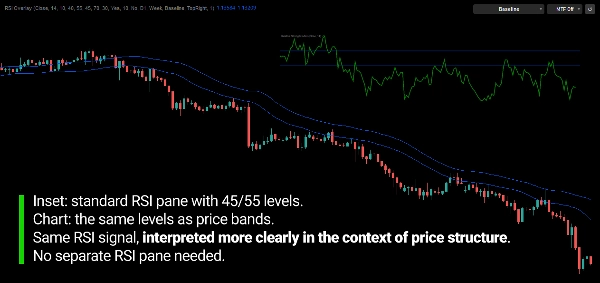
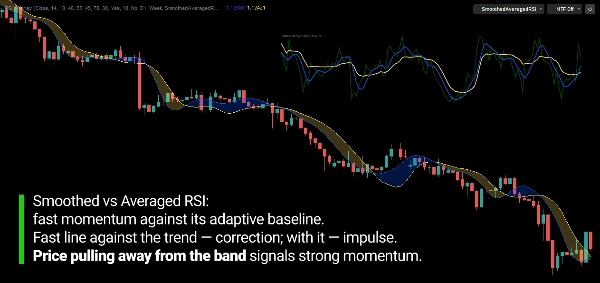
As Linhas de Base de Touro e Urso, os níveis de Sobrecompra e sobrevenda, e duas referências baseadas no RSI, RSI Suavizado e RSI Médio, são todos representados como linhas de preço.
As linhas são atualizadas a cada nova barra, para que continuem refletindo o estado mais recente do RSI em vez de permanecerem fixas em um preço histórico.
Estes não são níveis convencionais de suporte ou resistência.
Eles representam o preço no qual o valor correspondente do RSI seria alcançado sob o cálculo atual do RSI.
O indicador não tenta prever para onde o preço irá.
Ele mostra onde o preço está em relação aos níveis do RSI que você está observando.
COMO FUNCIONA
- O RSI é calculado usando a suavização de Wilder.
- Cada nível do RSI é convertido no preço que o produziria.
- As Linhas de Base de Touro e Urso marcam a zona de momentum ao redor da linha central (padrão 55 / 45).
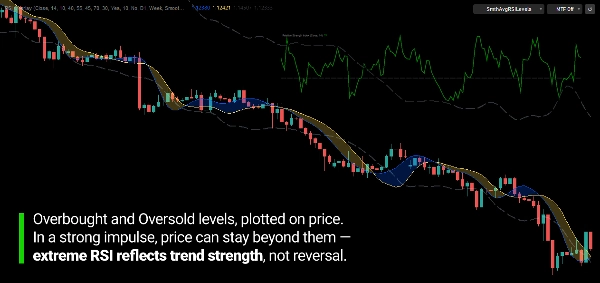
- Os níveis de Sobrecompra e sobrevenda são convertidos da mesma forma (padrão 70 / 30).
- RSI Suavizado e RSI Médio também são convertidos em linhas de preço.
AS REFERÊNCIAS DO RSI
Linhas de Base de Touro / Urso
Os níveis de preço nos quais o RSI entraria no território de momentum de alta ou baixa. O espaço entre eles mostra onde o momentum é neutro.
RSI Suavizado
Uma versão com ruído reduzido do RSI, mostrada como uma linha de preço que reage de forma mais suave.
RSI Médio
Uma média adaptativa mais lenta do RSI, mostrada como uma linha de preço. Fornece uma referência de momentum mais estável.
Sobrecomprado / Sobrevendido
Os níveis de preço nos quais o RSI alcançaria os limites de sobrecompra e sobrevenda.
Estas referências não são sinais automáticos.
Sua posição em relação ao preço, e entre si, fornece contexto sobre como o momentum está se desenvolvendo.
CONTEXTO MULTI-TIMEFRAME
O RSI não precisa vir do timeframe do gráfico que você está visualizando.
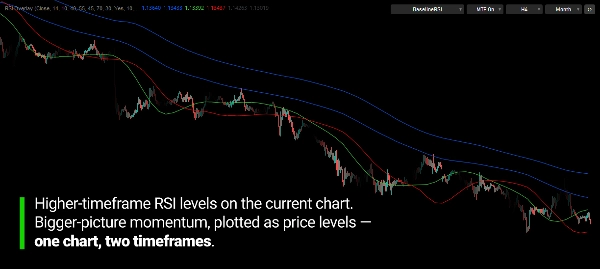
Por exemplo, um RSI semanal ou mensal pode ser projetado em um gráfico H1.
Isso coloca a estrutura de momentum de timeframe superior diretamente na ação de preço que você está observando.
Você escolhe quanta história é desenhada, da última hora até vários anos.
O timeframe selecionado deve ser superior ao timeframe do gráfico.
CONTROLE PELO GRÁFICO
Onze modos de exibição permitem mostrar apenas o que você precisa, desde um par limpo de linhas de base até o conjunto completo de referências do RSI.
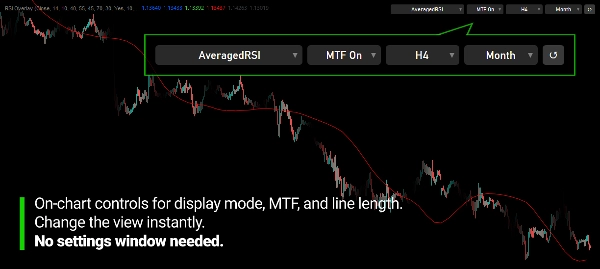
Uma barra de controle compacta no gráfico permite alternar o modo de exibição, ligar ou desligar o multi-timeframe, e alterar o timeframe e o comprimento sem reabrir as configurações.
Um botão de reset retorna tudo para seus parâmetros iniciais.
A barra pode ser colocada em qualquer canto ou escondida.
O QUE VOCÊ PODE OBSERVAR
O indicador foi projetado para tornar visíveis várias coisas:
- Onde o preço está em relação às zonas de momentum de alta e baixa
- Quão longe o preço está dos níveis de sobrecompra e sobrevenda, em termos de preço
- Mudanças de momentum ao redor das linhas de base
- Recuos e continuações em relação ao RSI suavizado e médio
- Contexto de momentum de timeframe superior em um gráfico de timeframe inferior
O RSI Overlay é uma ferramenta de medição, não um sistema autônomo de compra/venda.
FEITO PARA MOMENTUM EM TERMOS DE PREÇO
O objetivo não é substituir o RSI.
É eliminar a necessidade de traduzir um oscilador de volta para preço visualmente.
Tudo o que você sabe sobre o RSI ainda se aplica. Ele é simplesmente mostrado onde as decisões realmente são tomadas: no gráfico de preço.
CARACTERÍSTICAS PRINCIPAIS
- Níveis do RSI convertidos em níveis de preço no gráfico principal
- Linhas de Base de Touro e Urso (padrão 55 / 45)
- Níveis de preço de Sobrecompra e sobrevenda (padrão 70 / 30)
- Linha RSI Suavizada
- Linha RSI Média
- RSI multi-timeframe em gráficos de timeframe inferior
- Comprimento de exibição selecionável para linhas multi-timeframe
- 11 modos de exibição
- Barra de controle no gráfico com reset
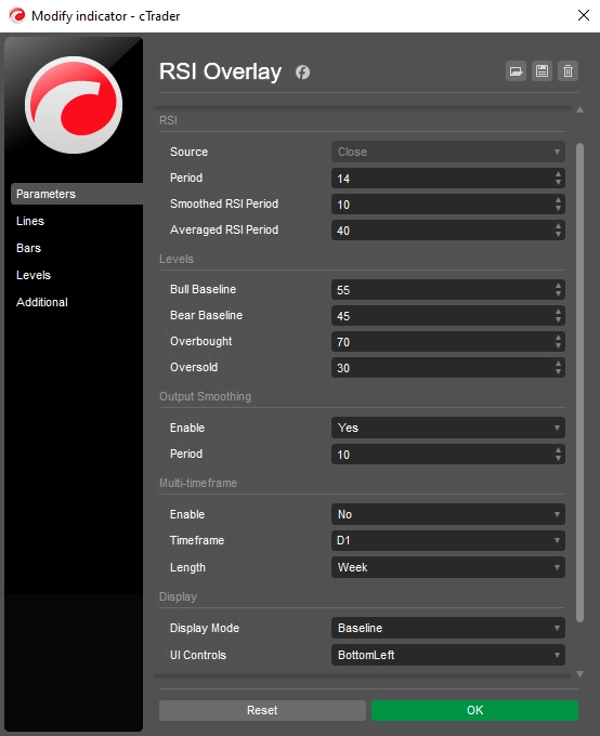
- Fonte configurável, período do RSI, suavização e média
- Cores, estilos de linha e espessura personalizáveis
---
Negociar envolve riscos. Este indicador é uma ferramenta de análise técnica e deve ser usado junto com uma gestão de risco apropriada.
Resumo
It supports multi-timeframe analysis by allowing RSI data from higher timeframes (e.g., weekly or monthly) to be displayed on lower timeframe charts, providing broader momentum context. Users can customize display modes, line styles, colors, and control parameters directly from an on-chart control bar, which includes options to reset settings and adjust timeframe and length without reopening menus.
RSI Overlay serves as a measurement tool to visualize where price stands relative to momentum zones and RSI thresholds in price terms. It does not generate automatic trading signals but aids in observing momentum shifts, pullbacks, and continuations aligned with RSI levels on the price chart.
Avaliações de clientes
5 | 100 % | |
4 | 0 % | |
3 | 0 % | |
2 | 0 % | |
1 | 0 % |
Conversa
Perguntas frequentes
Mais deste autor























Preço
