
Candle Timer & Strength Panel
インジケーター
1 購入済
バージョン 1.0、Jul 2025
Windows、Mac
4.3
レビュー: 3
説明
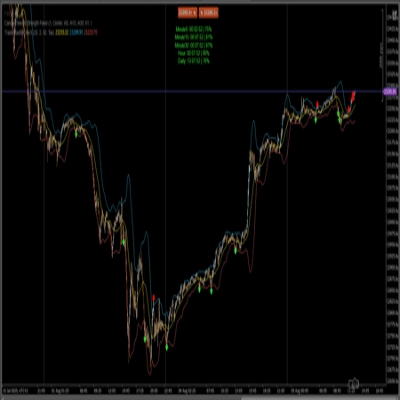
cTrader用キャンドルタイマー&ストレングスパネル
説明:
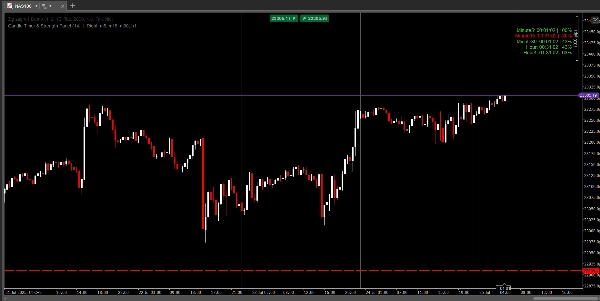
キャンドルタイマー&ストレングスパネルは、現在のキャンドルのクローズまでの残り時間と、最大5つのカスタム時間枠(例:M5、M15、M30、H1、H4)における各キャンドルのリアルタイムの強さ(%)を表示する、cTrader用の高度で常に表示されるオーバーレイです。
標準のキャンドルタイマー&ストレングスとは異なり、このバージョンはチャートの上部に固定された明確なパネルで全ての情報を表示するため、ズームやスクロールをしても常に最も重要なデータを確認できます。
主な特徴:
- 固定パネルオーバーレイ:
-
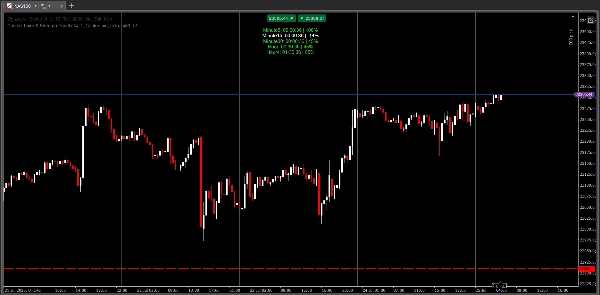
- 選択した各時間枠のタイマーと強さが、チャートの上部にある読みやすい単一のパネルで常に表示されます。
- パネルの位置を左、中央、右から選択可能。
- マルチタイムフレームキャンドルタイマー:
-
- 最大5つの選択した時間枠で次のキャンドルクローズまでのカウントダウンを確認できます。
- %で表示されるキャンドル強度:
-
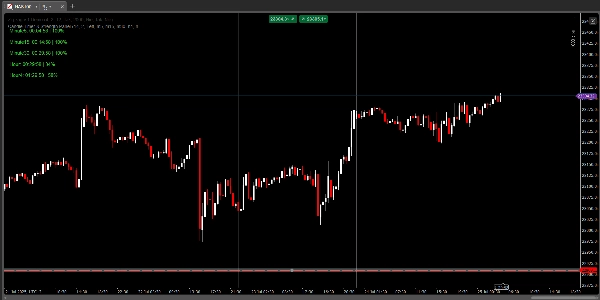
- 各時間枠の現在のキャンドルの強さを即座に表示(-100%から+100%まで)、クローズ位置がキャンドルの範囲内でどこにあるかに基づきます。
- 動的な色分け:強い強気は緑、強い弱気は赤、中立は白。
- カスタマイズ可能な表示:
-
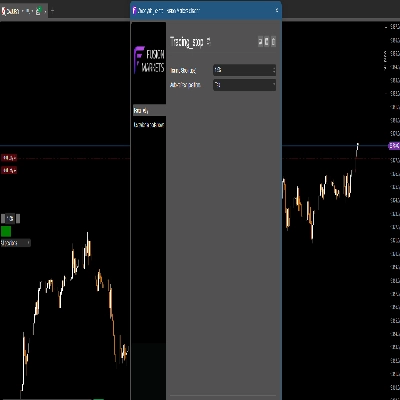
- フォントサイズ、垂直間隔、パネル位置を設定可能。
- お好みの時間枠を選択(M1、M5、M15、M30、H1、H4など)。
- 非標準のH4キャンドルを持つブローカー向けのH4開始時間パラメータ。
- こんな方に最適:
-
- 正確なキャンドルタイミングとモメンタムを一目で把握したいスキャルパーやデイトレーダー。
- クリーンで常に表示されるダッシュボードを求めるマルチタイムフレームトレーダー。
- エントリー/エグジットのタイミングやキャンドル読みのスキルを向上させたい方。
標準のキャンドルタイマー&ストレングスと何が違うのですか?
- パネルバージョン:
-
- すべてのタイマーと強さがチャートの上部に固定されたパネルで表示されます(キャンドルの隣ではありません)。
- ズームやスクロールしてもパネルは動かず消えません—常に同じ場所にあります。
- 読みやすく、迅速な意思決定やマルチタイムフレーム分析によりプロフェッショナルです。
- 標準バージョン:
-
- タイマーと強さはチャート上の最後のキャンドルの隣に表示され、ズームやスクロール時に価格動向と重なったり動いたりすることがあります。
パラメータ:
- 垂直間隔(行数)
- パネルの水平位置(左、中央、右)
- 時間枠1〜5(カスタム)
- H4開始時間(非標準のH4キャンドルを持つブローカー向け)
なぜキャンドルタイマー&ストレングスパネルを選ぶのか?
- ズームやスクロールに関係なく、最も重要なタイミングとモメンタムのデータを常に確認できます。
- マルチタイムフレームおよび高速取引に最適。
- クリーンでモダン、プロフェッショナルな外観。
- 使いやすく、完全にカスタマイズ可能で軽量。
キャンドルタイマー&ストレングスパネルを試して、あなたのマルチタイムフレーム取引を次のレベルへ!
私のすべてのインジケーターとボットを見る:
https://ctrader.com/pl?search=kobud.222&u=kobud.222
http://www.youtube.com/@Robi22-22
📩 ご質問?ご提案?割引?
プロフィールで連絡可能:Robikobud
概要
インジケーターのプロフィール
カスタマーレビュー
4.3
レビュー: 3
5 | 33 % | |
4 | 67 % | |
3 | 0 % | |
2 | 0 % | |
1 | 0 % |
カスタマーレビュー
August 2, 2025
20 percent less clicking is the line to watch. Bad setups become easier to pass on, and the chart still needs a final look.
July 29, 2025
the small win here is unclean signals are less tempting. A clean signal can still fail.
ディスカッション
よくあるご質問
cTrader Storeで入手可能な取引ボット、インジケーター、プラグインなどの商品は、第三者の開発者が提供するものであり、情報と技術の取得のみを目的としてご利用いただけます。cTrader Storeはブローカーではなく、投資助言や個人的な推奨を行うことも、将来のパフォーマンスを保証することもありません。
この作成者の他の商品


価格
登録日 31/12/2024
7
販売
1.14K
無料インストール