
Gold Emperor
インジケーター
6 購入済
バージョン 2.0、Dec 2025
Windows、Mac
5.0
レビュー: 3
説明
Gold Emperor: XAUUSDの高度なテクニカル分析
Gold Emperor はトリオの中でも最高峰で、特に XAUUSD(金)向けに設計されています。金は極端な流動性と爆発的なボラティリティを兼ね備えているためユニークです。このボットは、標準的な指標が遅れすぎる「フラッシュムーブ」を処理するように調整されています。そのメカニズムはFX SniperやIndex Hunterよりも速く、より攻撃的です。
1. コアメカニズム
A. トリプルスロープフュージョン
金は直線的に動くのではなく、加速します。Gold Emperorは同時に3つの異なる時間枠の スロープ(速度)を分析し、整合性を検出します:
- マイクロ(M1): 10期間のスロープ(即時反応)。
- ファスト(M5): 20期間のスロープ(「パルス」)。
- トレンド(H1): 20期間のスロープ(「リバー」)。
- 違い: FX SniperがH4の確認を待つのに対し、Gold EmperorはM1とM5が積極的に整合すればトリガーをかけることをいとわず、金の動きは4時間の確認には速すぎることを認識しています。
B. 動的マルチデイピボット(Day2 / Day3)
金は1日に20~30ドル簡単に動くため、標準の「デイリーピボット」を無視することが多いです。このボットは 「スーパー・ピボット」を使用します:
- ロジック: 過去の高値・安値・終値データを集約し、直近 48時間(Day2)または 72時間(Day3)から「真の」構造的レベルを見つけます。
- 理由: 3日間維持されたレベルは、12時間維持されたレベルよりも金のアルゴリズムにとってはるかに重要です。
C. 計算された「ゴールドラッシュ」確率
信頼度スコアはボラティリティに合わせて調整されています:
- 実現可能性スコア: 現在の ATR(平均真の範囲)に基づき、ターゲットまでの距離が現実的かどうかを計算します。
- カテゴリ:
-
- ゴールドラッシュ(ライム): 80%以上のスコア。強いモメンタム+価格がターゲットの1ATR以内。
- 可能性あり(イエロー): 50-80%。良いセットアップだが動きが遅いかもしれません。
- リスキー(レッド): ターゲットがATRの2倍以上離れている(日内の統計的にありえない可能性)。
D. 「ゴールデンシールド」保護
金のアカウントはスパイク時のマージンコールで破綻します。
- 指標:
AccountEquity / (PipValue * MinLot)
。 - 視覚的表示: 「🛡️ GOLD SHIELD: ON」は、アカウントがマージンストップアウトレベルに達することなく大きなボラティリティスパイクに耐えられる場合にのみ表示されます。そうでなければ「⚠️ LOW MARGIN」と警告します。
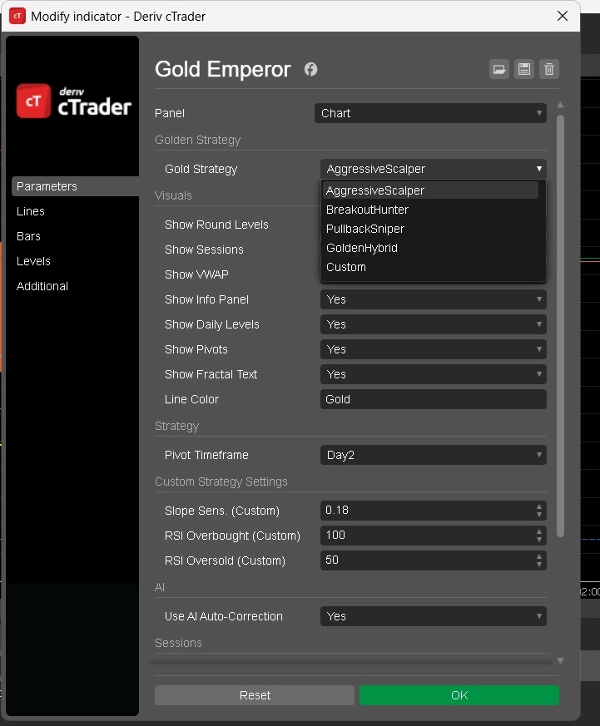
2. 利用可能なモード(戦略)
Gold Strategy
パラメータは4つの異なる動作を可能にします:
1. モード:AggressiveScalper(デフォルト)
- 最適: 活発なロンドン/NYセッション。
- ロジック:
-
- トリガー: M1スロープ > 0 かつ M5スロープ > 0。
- 説明: 「高頻度」。1分足チャートが5分足チャートと整合したらすぐにエントリーします。時間足のトレンドは気にしません。次の2ドルの動きを狙います。
- センチメント: 「SCALP BUY 🚀」または「SCALP SELL 🔻」。
2. モード:BreakoutHunter(ボラティリティ)
- 最適: ニュースイベントやオープニング。
- ロジック:
-
- トリガー: H1スロープ > 0.1 (高い閾値)。
- 説明: 「モメンタムのみ」。小さな動きを無視し、H1チャートが垂直のスパイクを示すのを待ちます。これは大きなブレイクアウト(例えば10ドルの動き)を示します。
- センチメント: 「BREAKOUT UP! 🚀」。
3. モード:PullbackSniper(リトレースメント)
- 最適: 確立されたトレンドの押し目でのエントリー。
- ロジック:
4. モード:カスタム(ユーザー定義)
- ロジック: 手動で設定した
Slope Sens
および
RSI
の設定を使用します。
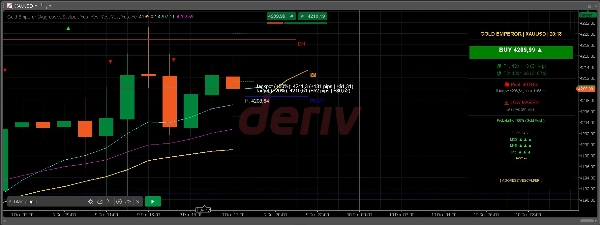
3. 「Emperor」パネル
- ヘッダー: 「GOLD EMPEROR | XAUUSD」。
- 優先設定: 「BUY 2045.50 ▲」。
- ターゲット: T1(20%推定)およびT2(50%推定または「ジャックポット」)。
- 予測: M30、M45、H1のスロープの連続的な内訳。
- 履歴: 最後の10回の予測(30分後に検証済み)を追跡し、「勝率」(例:「History: ✅✅❌✅✅」)を表示します。
概要
AIによる概要
Gold Emperor is an AI-driven technical indicator designed specifically for trading XAUUSD (Gold). It addresses gold’s unique combination of high liquidity and rapid volatility by using advanced mechanics that respond faster than typical indicators. The core analysis involves a Triple-Slope Fusion method, simultaneously evaluating price velocity across three timeframes: 1-minute (micro), 5-minute (fast), and 1-hour (trend) slopes to detect alignment and momentum.
The indicator incorporates Dynamic Multi-Day Pivots by aggregating high, low, and close prices over 48 to 72 hours to identify significant structural levels beyond standard daily pivots. It calculates a "Gold Rush" probability score based on the current Average True Range (ATR) to assess the feasibility of price targets, categorizing setups into strong momentum, possible, or risky.
Gold Emperor also features a "Golden Shield" protection metric that monitors account equity relative to position size to warn users of potential margin risks during volatility spikes.
Users can select from four trading modes: AggressiveScalper for high-frequency trades during active sessions; BreakoutHunter for volatility-driven moves around news events; PullbackSniper for trend entries on retracements; and a Custom mode allowing manual slope sensitivity and RSI settings.
The indicator’s panel displays current buy/sell preferences, target levels, slope forecasts, and a history of recent predictions with win rate tracking.
インジケーターのプロフィール
カスタマーレビュー
5.0
レビュー: 3
5 | 100 % | |
4 | 0 % | |
3 | 0 % | |
2 | 0 % | |
1 | 0 % |
カスタマーレビュー
December 22, 2025
Gold Emperor is a focused trend and momentum filter tailored for XAUUSD. Fast, stable and easy to read, it helps stay aligned with gold’s impulsive moves and avoid noisy ranges. Best used as confirmation alongside structure and liquidity tools.
December 17, 2025
Demo first, then maybe small size if the notes look sane. The result needs a journal.
December 15, 2025
The setup improves when one first glance should not become the only input, and It needs a boring test before bigger size.
ディスカッション
よくあるご質問
Prop
Breakout
Scalping
Commodities
RSI
XAUUSD
ATR
cTrader Storeで入手可能な取引ボット、インジケーター、プラグインなどの商品は、第三者の開発者が提供するものであり、情報と技術の取得のみを目的としてご利用いただけます。cTrader Storeはブローカーではなく、投資助言や個人的な推奨を行うことも、将来のパフォーマンスを保証することもありません。


これも好きかも


価格
登録日 08/11/2025
24
販売
59
無料インストール