
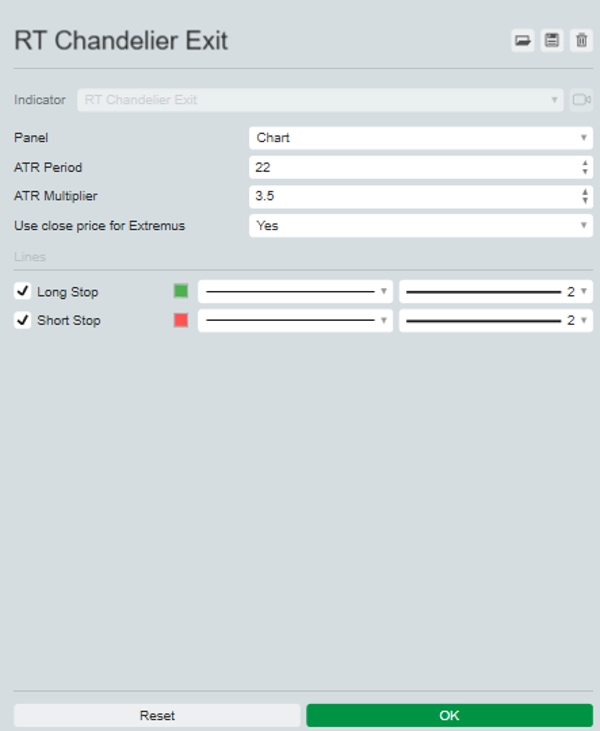
RT Chandelier Exit
Indikator
4 käufe
Version 1.0, Sep 2024
Windows, Mac
Beschreibung
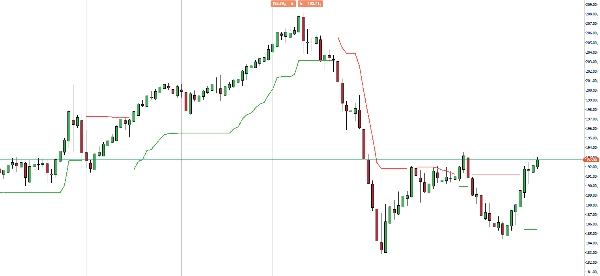
Wir stellen vor den Chandelier Exit Indikator, Ihr ultimatives Werkzeug zur Optimierung von Trade-Ausstiegen mit Präzision und Vertrauen.
Dieser Indikator berechnet dynamisch Stop-Loss-Punkte basierend auf dem höchsten Hoch und dem ATR und bietet klare visuelle Hinweise in Ihrem Chart in Echtzeit.
Entwickelt, um Ihnen zu helfen, Gewinne zu sichern und sich gegen Marktumkehrungen zu schützen, sorgt der Chandelier Exit dafür, dass Sie der Kurve voraus bleiben.
Perfekt für Trader, die ihre Strategie mit zuverlässigen Ausstiegssignalen verbessern möchten, bietet dieser Indikator einen einfachen, visuellen Ansatz zur Risikosteuerung. Verbessern Sie Ihr Trading-Werkzeugset und sichern Sie Ihre Gewinne mit dem Chandelier Exit.
Zusammenfassung
KI-Zusammenfassung
The RT Chandelier Exit indicator dynamically calculates stop-loss levels using the highest high and Average True Range (ATR) to provide real-time visual cues on trading charts. It is designed to help traders optimize trade exits by locking in profits and protecting against market reversals. This indicator supports various markets including Forex, cryptocurrencies, commodities, stocks, and indices, with symbols such as BTCUSD, EURUSD, GBPUSD, XAUUSD, NAS100, and USDJPY. It offers a straightforward, visual approach to risk management, making it suitable for traders seeking reliable exit signals to enhance their trading strategies.
Indikatorprofil
Kundenbewertungen
0.0
Bewertungen: 0
Kundenbewertungen
Bisher gibt es keine Bewertungen für dieses Produkt. Haben Sie es schon ausprobiert? Dann können Sie die erste Person sein, die andere darüber informiert!
Diskussion
Häufig gestellte Fragen (FAQ)
BTCUSD
Forex
Signal
Indices
EURUSD
Commodities
GBPUSD
NZDUSD
Prop
Scalping
Crypto
Stocks
XAUUSD
NAS100
ATR
USDJPY
Über den cTrader Store verfügbare Produkte, einschließlich Handelsbots, Indikatoren und Plugins, werden von externen Entwicklern bereitgestellt und nur zu Informations- und technischen Zugriffszwecken verfügbar gemacht. cTrader Store ist kein Broker und erbringt keine Anlageberatung, persönlichen Empfehlungen oder eine Garantie für zukünftige Performance.


![„[Stellar Strategies] Inside Bar with Signals“-Logo](https://cdn.ctrader.com/image/webp/1d9e8bfa-3b2c-4440-bb37-5856902008a7_30683)


![„Gaussian Channel [Iridio Capital]“-Logo](https://cdn.ctrader.com/image/webp/7c039209-5573-4a54-a072-f9528b503103_41960)

Preis
Seit 25/09/2024
20
Verkäufe