
VIX - volatility indicator
Indikator
2 käufe
Version 1.2, Apr 2026
Windows, Mac
4.5
Bewertungen: 2
Beschreibung
Dieser proprietäre VIX-Indikator, angetrieben vom Average True Range (ATR), liefert eine präzise und klare Analyse der Marktvolatilität, optimiert für cTrader 5.5.13+. Er kombiniert skalierte VIX-Bewegungen mit Volumenanalysen, um bedeutende Verschiebungen und potenzielle Ausbrüche zu bestätigen.
Hauptmerkmale & Codequalität
- Keine Fehler/Warnungen: Vollständig auf die neueste cTrader-API refaktoriert, wodurch alle veralteten Fehler und Warnungen für maximale Stabilität und Leistung beseitigt wurden.
- ATR-basierter VIX: Bietet eine reaktionsschnelle Messung der Volatilität, normalisiert auf extreme Marktbedingungen.
- Duale Bestätigung: Verwendet Volatilität (VIX-Linie) kombiniert mit Tick-Volumen-Daten, um Ausbruchssignale mit hoher Wahrscheinlichkeit zu validieren.
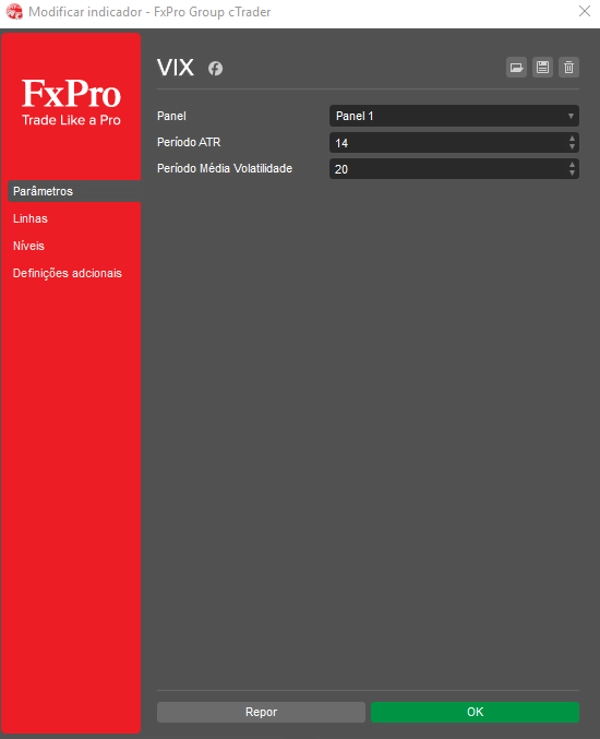
Passen Sie Ihre Einrichtung für maximale Erkenntnisse an
Passen Sie den Indikator einfach an Ihre Handelsstrategie an, indem Sie die gewünschten Werte für Niedriges VIX-Niveau und Hohes VIX-Niveau Schwellenwerte einstellen. Zusätzlich können Sie den VIX-Skalierungsfaktor anpassen, um die Höhe und Visualisierung der VIX-Linie im unteren Panel präzise zu steuern.
Wie man Ausbruch- & Konsolidierungssignale liest
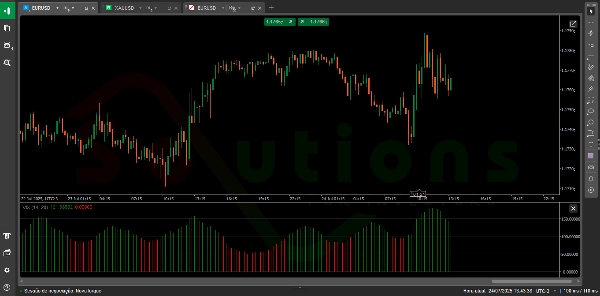
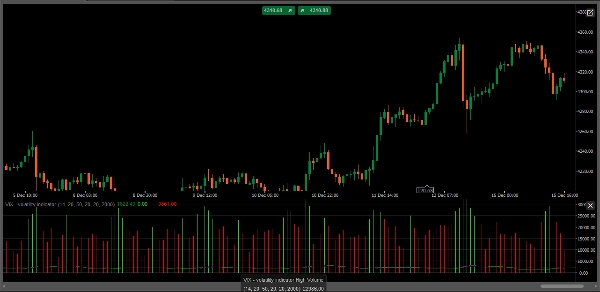
- Ausbruchssignal (Hohe Volatilität): Wenn die VIX-Linie stark über das Hohe VIX-Niveau UND von hohem Volumen (angezeigt durch das Hohe Volumen Histogramm) begleitet wird, bestätigt dies extreme Angst/Gier und signalisiert einen Ausbruch mit hoher Wahrscheinlichkeit.
- Konsolidierungssignal (Niedrige Volatilität): Wenn die VIX-Linie unter das Niedrige VIX-Niveau fällt, deutet dies oft auf eine Phase der Marktberuhigung, enge Konsolidierung oder potenzielle Mittelwertumkehr hin — ideal, um Ihren nächsten Schritt vorzubereiten oder das Risiko zu reduzieren.
- Volumen-Einblicke: Der Indikator zeigt im Hintergrund Histogramme für hohes Volumen (grün) und niedriges Volumen (rot) an, sodass Sie die Liquidität und Überzeugung hinter der aktuellen Kursbewegung sofort einschätzen können.
Zusammenfassung
KI-Zusammenfassung
The VIX - Volatility Indicator is a proprietary tool designed for the cTrader platform (version 5.5.13 and above) that measures market volatility using an Average True Range (ATR)-based approach. It combines a scaled VIX line with tick volume data to provide dual confirmation of market conditions, helping traders identify potential breakouts and consolidation phases.
Key features include:
- ATR-based VIX calculation for responsive volatility measurement normalized to detect extreme market conditions.
- Volume analysis with high (green) and low (red) volume histograms to assess liquidity and conviction behind price movements.
- Customizable parameters allowing users to set Low VIX Level and High VIX Level thresholds, as well as adjust the VIX Scale Factor for optimal visualization.
Usage signals:
- A breakout alert occurs when the VIX line surpasses the High VIX Level accompanied by high volume, indicating potential market breakouts driven by extreme fear or greed.
- A consolidation signal is identified when the VIX falls below the Low VIX Level, suggesting periods of low volatility, market calm, or potential mean reversion.
This indicator supports analysis across various markets including Forex, indices, commodities, stocks, and cryptocurrencies.
Indikatorprofil
Kundenbewertungen
4.5
Bewertungen: 2
5 | 50 % | |
4 | 50 % | |
3 | 0 % | |
2 | 0 % | |
1 | 0 % |
Kundenbewertungen
March 6, 2025
ngl, breaks are easier to judge and that is enough to keep testing it. It is not the whole trading plan.
February 28, 2025
reads better when the chart already supports the idea. Spread and slippage need a line in the notes.
Diskussion
Häufig gestellte Fragen (FAQ)
BTCUSD
Forex
Signal
Breakout
Indices
EURUSD
Commodities
GBPUSD
NZDUSD
Prop
Crypto
Stocks
XAUUSD
NAS100
USDJPY
Über den cTrader Store verfügbare Produkte, einschließlich Handelsbots, Indikatoren und Plugins, werden von externen Entwicklern bereitgestellt und nur zu Informations- und technischen Zugriffszwecken verfügbar gemacht. cTrader Store ist kein Broker und erbringt keine Anlageberatung, persönlichen Empfehlungen oder eine Garantie für zukünftige Performance.


Preis
Seit 05/02/2025
31
Verkäufe