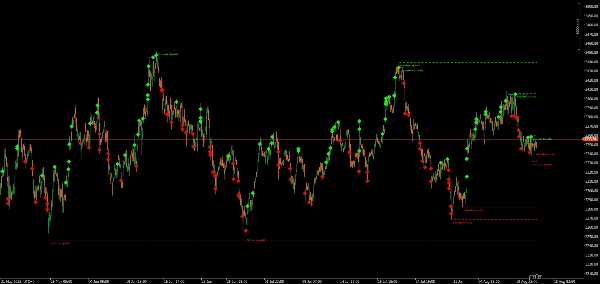
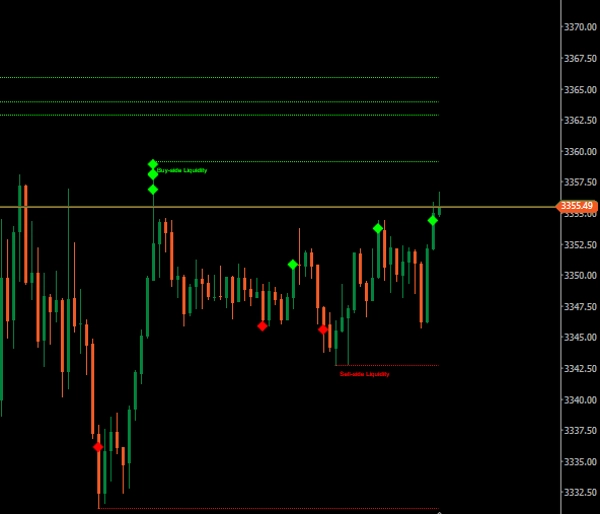
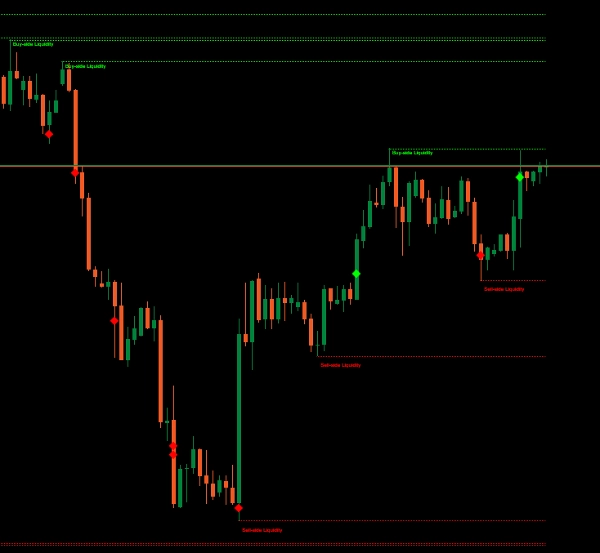
Logo „BSL_SSL_Liqudity”
BSL_SSL_Liqudity
Przesłany obraz „BSL_SSL_Liqudity”
Od 22/06/2025
49
Sprzedaż
48
Bezpłatne instalacje

The Buy-Side & Sell-Side Liquidity (BSL/SSL) Indicator is designed for traders who follow (ICT) or liquidity-based strategies. It automatically detects key liquidity zones in the market—highlighting swing highs (Buy-Side Liquidity) and swing lows (Sell-Side Liquidity)—and monitors whether these levels have been swept or remain intact.

  1. BSL (Buy-Side Liquidity) – Marks recent swing highs where stop-loss orders from short positions or breakout buy orders may be clustered.
  2. SSL (Sell-Side Liquidity) – Marks recent swing lows where stop-loss orders from long positions or breakout sell orders may be sitting.
  3. Swept Markers – When price breaches a marked liquidity level, the indicator plots a diamond marker to show the sweep.

Who Is It For?

  • ICT Methodology Traders
  • Liquidity Grab / Stop Hunt Strategists
  • Scalpers & Day Traders targeting session-based moves
  • Swing Traders looking for high-probability reversal points

Benefits

  • Visual clarity – Instantly see where the market is likely to seek liquidity.
  • Time efficiency – No more manually marking swings and checking for sweeps.


  • Strategic advantage – Combine with
  • FVGs,
  • market structure to refine trade setups.
  • Session kill zones
  • macros


My Other Products


Disclaimer: Trading involves risk, and past results do not guarantee future performance. Use proper risk management, follow stop-loss levels, and trade responsibly. I am not liable for any financial losses from using these algorithms.use these indicators for your confluence and reduce burden your charting markup time

Indicator profile
0.0
Opinie: 0
Opinie klientów
Ten produkt nie ma jeszcze opinii. Wypróbowałeś(-aś) go już? Bądź pierwszy(-a) i powiedz o tym innym!
BTCUSD
Forex
Indices
EURUSD
Commodities
XAUUSD
NAS100
Products available through cTrader Store, including trading bots, indicators and plugins, are provided by third-party developers and made available for informational and technical access purposes only. cTrader Store is not a broker and does not provide investment advice, personal recommendations or any guarantee of future performance.

Więcej od tego autora

trading stress-relief “mini-game”
MarketStructurePro – Smart BOS/CHoCH
trading stress-relief “mini-game”
Professional Fair Value Gaps with multitimeframe spot on
Traders Dynamic Index (TDI) — Divergence Edition
Killzone Session With VWAP – Precision Meets Price Action
Perfect for traders who demand a clear overview of multiple timeframes at a glance.
Market Profile TPO for cTrader — full auction logic, IB, POC, VA zones, histogram and O/X markers with time
Institutional Session Levels Pro OHLC,Prev(D,W,M OHLC)
Market Sessions
Multi-TF FVG + Smart Fibonacci
Multi-Time Frame Candlesticks FVG with BSL/SSL Premium Suite

Możesz także polubić

Volume Weighted Average Price (VWAP)
Basic & FREE. Plots New York Initial Balance (NY local time) and projects IB High, IB Low, and midline.
Adaptive Median Filter calculates price median to eliminate noise and extreme values.
Professional Trading Indicator Transform Your Trading with Intelligent Signal Detection RenkoProfit
Gold Market Maker Zones; Non-repainting Supply & Demand detector for XAUUSD. Precise institutional zones for cTrader.
Laguerre RSI: smoother, faster RSI with less noise. Great for spotting reversals and timing entries.
Performance Panel von BullMoon Finance: Analysiere Deine cTrader-Historie visuell direkt im Chart!
Logo „BarSentiments”
5.0
(2)
Za darmo
This Indicator is a technical analysis tool that measures the strength and direction of market sentiment
A precision tool for measuring how efficiently price moves from point A to B.
Master trends with Smart ADX: MTF Scanner, precise Buy/Sell signals, Divergence & clear Exit targets 🎯
Key Levels Indicator – Automatically plots monthly, weekly, and daily highs/lows with customizable colors & styles
Trend-focused EMA indicator with volatility bands and dynamic support/resistance for continuation setups.
ICT First Presented FVG
🚀📈 Plot buy/sell signals on Range Bars using Moving Averages and RSI. Clear, actionable trading insights.🚀📈
heatmap
Automatically plots Fibonacci retracement levels using the highest and lowest points of a customizable time range
buy and sell
Od 22/06/2025
49
Sprzedaż
48
Bezpłatne instalacje