
Beschreibung
Einführung des fortschrittlichen QQE (Qualitative Quantitative Estimation) Indikators, ein leistungsstarkes Werkzeug, das zwei QQE-Indikatoren für verbesserte Handelsanalysen kombiniert.
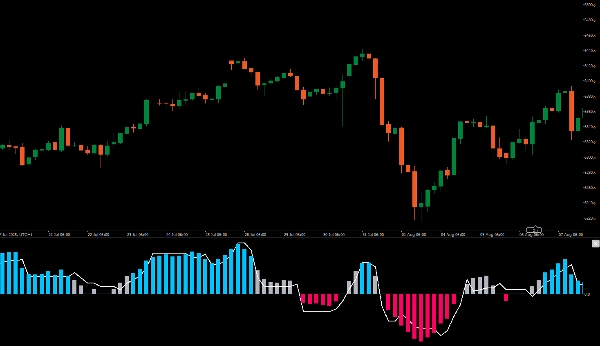
Ein QQE wird im Chart als Säulen dargestellt, während der andere im Hintergrund mit einem 50-Perioden-Bollinger-Band als Null-Linie arbeitet.
Diese Einrichtung ermöglicht es Ihnen, das Marktmomentum visuell zu beurteilen und potenzielle Einstiegspunkte klar zu identifizieren. Wenn beide QQE-Indikatoren übereinstimmen, sehen Sie klare blaue oder rote Balken, die starke Kauf- oder Verkaufssignale anzeigen.
Verbessern Sie Ihre Handelsstrategie mit dem QQE-Indikator für fundiertere Entscheidungen und eine höhere Genauigkeit bei Ihrer Marktanalyse.Einführung des fortschrittlichen QQE (Qualitative Quantitative Estimation) Indikators, ein leistungsstarkes Werkzeug, das zwei QQE-Indikatoren für verbesserte Handelsanalysen kombiniert.
Ein QQE wird im Chart als Säulen dargestellt, während der andere im Hintergrund mit einem 50-Perioden-Bollinger-Band als Null-Linie arbeitet.
Diese Einrichtung ermöglicht es Ihnen, das Marktmomentum visuell zu beurteilen und potenzielle Einstiegspunkte klar zu identifizieren. Wenn beide QQE-Indikatoren übereinstimmen, sehen Sie klare blaue oder rote Balken, die starke Kauf- oder Verkaufssignale anzeigen.
Verbessern Sie Ihre Handelsstrategie mit dem QQE-Indikator für fundiertere Entscheidungen und eine höhere Genauigkeit bei Ihrer Marktanalyse.
Zusammenfassung
Kundenbewertungen
5 | 100 % | |
4 | 0 % | |
3 | 0 % | |
2 | 0 % | |
1 | 0 % |


