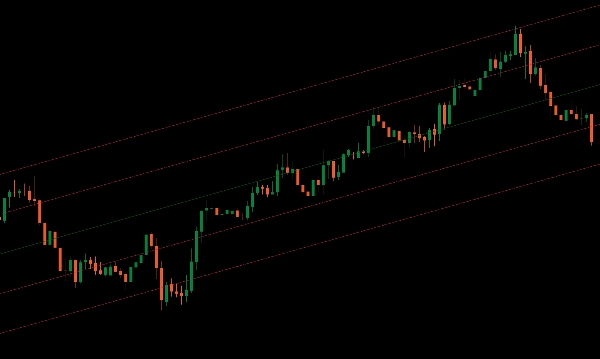
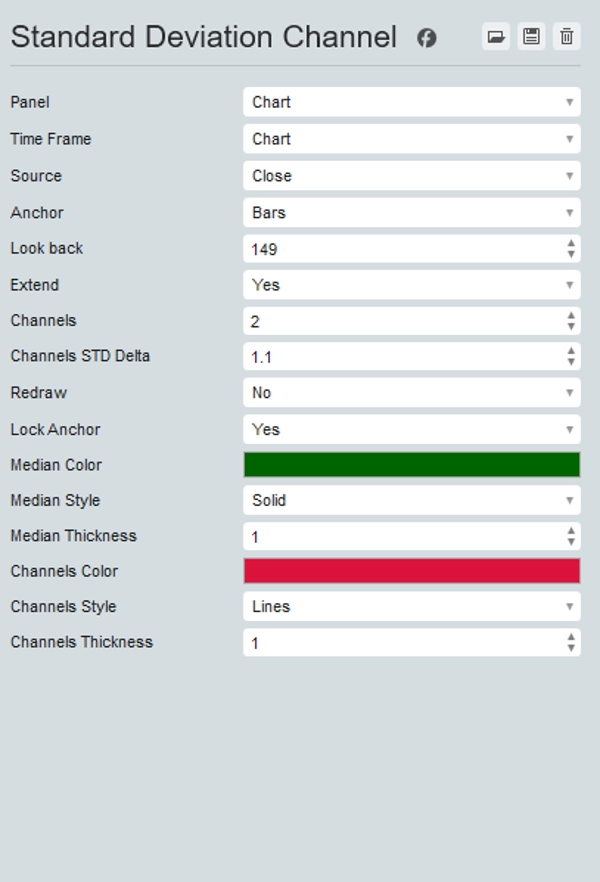
„Standard Deviation Channel“-Logo
Standard Deviation Channel
In „Standard Deviation Channel“ hochgeladenes Bild
Seit 25/09/2025
20
Verkäufe
178
Kostenlose Installationen

Introducing the Standard Deviation Channel indicator for cTrader, a powerful tool designed to help you visualize market trends with precision.

This indicator displays the median of a specified period on your chart, providing a central reference point for price movements.

Additionally, it allows you to add a desired number of upper and lower channels at multiples of the standard deviation, giving you a clear view of price volatility and potential breakout zones.

Perfect for traders seeking enhanced analytical capabilities, the Standard Deviation Channel indicator helps you identify trend directions and potential reversal points with ease.

Upgrade your trading toolkit with the Standard Deviation Channel for superior market analysis and decision-making.

Indicator profile
0.0
Bewertungen: 0
Kundenbewertungen
Bisher gibt es keine Bewertungen für dieses Produkt. Haben Sie es schon ausprobiert? Dann können Sie die erste Person sein, die andere darüber informiert!
BTCUSD
Forex
Breakout
Indices
EURUSD
Commodities
GBPUSD
NZDUSD
Prop
Scalping
Crypto
Grid
Stocks
XAUUSD
NAS100
USDJPY
Products available through cTrader Store, including trading bots, indicators and plugins, are provided by third-party developers and made available for informational and technical access purposes only. cTrader Store is not a broker and does not provide investment advice, personal recommendations or any guarantee of future performance.

Mehr von diesem Autor

Professional execution engine for the Visual Risk Terminal. Instant batch orders, PnL syncing, and automated hedging.
1
Gewinnfaktor
0%
Maximaler Rückgang
Optimize exits with Chandelier Exit! Visualize stop-loss points dynamically for improved trading precision and safety.
Enhance trading with ATR Bands! Visualize market volatility using dynamic upper and lower ATR bands for precise decision
Enhance MACD Histogram! Visualize bull and bear price changes with vibrant colors for clearer, more insightful trading.
Unlock trading precision with QQE! Dual QQE indicators with a Bollinger Bands zero line provide clear buy/sell signals.
Identify and trade breakouts with Consolidation Zones! Visualize price consolidation areas for trading opportunities.
„Stochastic RSI PRO“-Logo
5.0
(1)
$ 28
/
$40
Unlock Stochastic RSI PRO in cTrader! Overlay RSI, highlight zones, and identify divergences with customizable settings.
Visual risk management terminal for cTrader. Set Lot size, SL, and TP via chart lines with real-time PnL projections.
Customize your Moving Average! Choose any timeframe and price source for precision and flexibility in your analysis.
Customize the MACD! Choose colors, get real-time tick updates, and see crossover points for enhanced trading precision.
Advanced MACD & Supertrend bot. Professional trend-following logic with ATR risk management and active profit-taking.
18%
1.82
Gewinnfaktor
20.05%
Maximaler Rückgang
Visualize Bollinger Bands with a colored cloud for clarity. Enhance your trading precision with this dynamic indicator!

Das könnte Sie auch noch interessieren

MACD Sniper Elite Multi-Timeframe/ Spot trend strength across multiple timeframes with sniper-level clarity.
Universal Renko Overlay. Tick-Accurate Renko Bars Aligned with Futures Contract Specifications.
Inside Candle PRO - Professional Inside Bar Pattern Detector
📊Zones Supply & Demand: Identifies key price levels with high volume concentration, marking Supply/Demand Zones & Marke
This code is a custom scalping indicator for the cTrader platform.
MACD Indicator with Histogram that plots Colors Based on Direction Above and Below the Zero Line.
INSTITUTIONAL VWAP
See USD demand in one line—Composite OBV fuses six major FX pairs into a clear momentum gauge.
Clean higher timeframe trend indicator designed to filter noise and show clear market direction.
Turn data into precision trades with AlphaTrend Pro Max — advanced trend, signal & structure analysis in one.
Future-AI indicator.
Learn candlestick patterns with live signals, objective rules, context notes, and an interactive quiz training mode.
This will allow you to have SESSIONS on the chart. London, New York, Asian session and you can customize the times.
A visual indicator designed to help traders identify and track market activity across different trading sessions.
Indicator that calculates the slope of a moving average (SMA) and displays the value of the slope in degrees
Anchored VWAP
A function demo version of VWAP indicator with std. dev. bands. Expired on 1st Aug, 2025.
Seit 25/09/2025
20
Verkäufe
178
Kostenlose Installationen