
DMI 3 bar v2
Gösterge
2 satın almalar
Sürüm 1.0, Dec 2024
Windows, Mac
5.0
Değerlendirmeler: 1
Açıklama
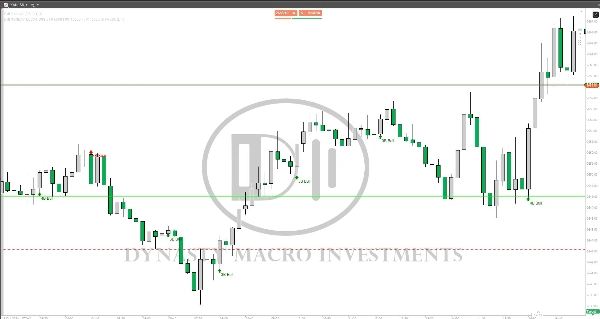
3 ve 4 BAR DESENİ (Sabah yıldızı / Akşam yıldızı) için AL ve SAT sinyallerini gösterir. Ayarlanabilir ve OKLARI GÖSTERİR.
Özet
YZ özeti
DMI 3 bar v2 is a technical indicator designed to identify BUY and SELL signals based on 3 and 4 bar candlestick patterns, specifically the Morning Star and Evening Star formations. The indicator is adjustable to user preferences and visually displays signals using arrows on the chart. It supports pattern recognition to assist traders in decision-making by highlighting potential reversal points indicated by these classic candlestick patterns.
Gösterge profili
Müşteri değerlendirmeleri
5.0
Değerlendirmeler: 1
5 | 100 % | |
4 | 0 % | |
3 | 0 % | |
2 | 0 % | |
1 | 0 % |
Tartışma
SSS
cTrader Store üzerinden erişilebilen işlem botları, göstergeler ve eklentiler gibi ürünler, üçüncü taraf sağlayıcılar tarafından sağlanır ve yalnızca bilgilendirme ve teknik erişim amaçlarıyla sunulur. cTrader Store bir broker değildir ve yatırım tavsiyesi, kişisel öneriler vermez veya gelecekteki performansı garanti etmez.
Bu oluşturanın diğer ürünleri


Fiyat
2
Satışlar