Penerangan
Penunjuk ini direka untuk menjalankan analisis regresi bukan linear berganda menggunakan empat pembolehubah bebas: harga tutup, buka, tinggi, dan rendah.
Berikut adalah komponen dan fungsinya:
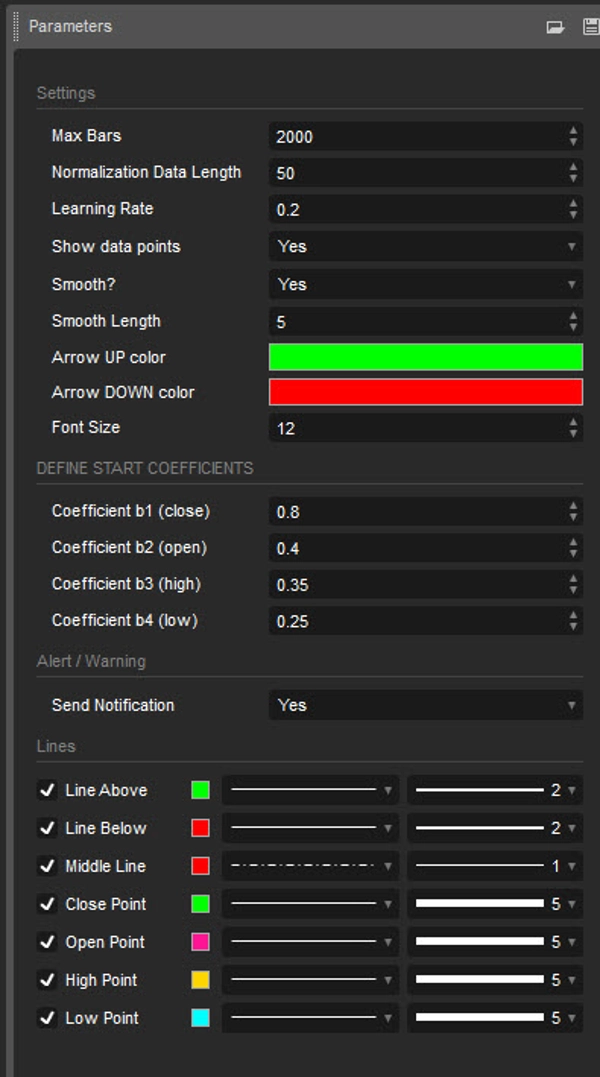
Input:
- Panjang Data Normalisasi: Panjang data yang digunakan untuk normalisasi.
- Kadar Pembelajaran: Kadar di mana algoritma belajar dari kesilapan.
- Tunjukkan titik data: Tunjukkan plot data input yang dinormalisasi (tutup, buka, tinggi, rendah)
- Lembut?: Pilihan untuk melicinkan output.
- Panjang Lembut: Panjang pelicinan jika diaktifkan.
- Tentukan pekali permulaan: Pekali awal untuk persamaan regresi.
Normalisasi Data:
Skrip menormalkan data input ke julat antara 0 dan 1 menggunakan nilai tertinggi dan terendah dalam panjang yang ditentukan.
Regresi Bukan Linear:
Ia mengira persamaan regresi menggunakan pekali input dan data yang dinormalisasi. Persamaan yang digunakan adalah jumlah berwajaran pembolehubah bebas, dengan pekali disesuaikan secara iteratif menggunakan penurunan kecerunan untuk meminimumkan kesilapan.
Pengiraan Kesilapan:
Skrip mengira kesilapan antara nilai sebenar dan nilai yang diramalkan.
Penurunan Kecerunan:
Pekali dikemas kini secara iteratif menggunakan penurunan kecerunan untuk meminimumkan kesilapan.
Visualisasi:
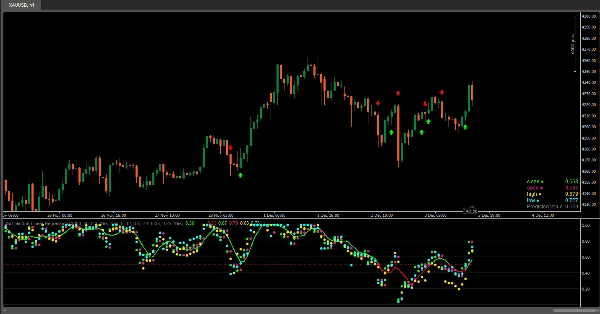
- Plot data input yang dinormalisasi (tutup, buka, tinggi, rendah).
- Penunjuk menyediakan visualisasi nilai data yang dinormalisasi (tutup, buka, tinggi, rendah) dalam bentuk penanda bulat pada carta, membolehkan pengguna dengan mudah memerhati kedudukan relatif nilai-nilai ini berbanding satu sama lain dan garis regresi.
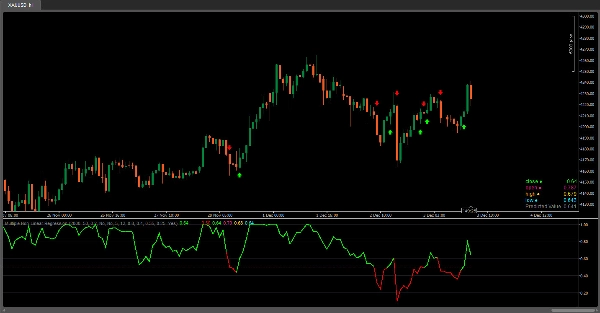
- Plot garis regresi.
- Gradasi warna pada garis regresi berdasarkan nilai dan warna bar.
- Paparan data input yang dinormalisasi dan nilai ramalan dalam jadual.
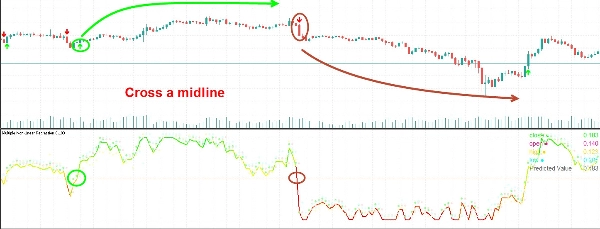
- Isyarat untuk persilangan dengan garis tengah (0.5).
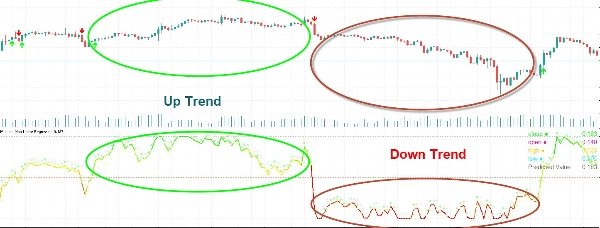
Interpretasi:
Pengguna boleh mentafsir garis regresi dan persilangannya dengan garis tengah (0.5) sebagai isyarat untuk peluang beli atau jual yang berpotensi.
Penunjuk ini membantu pengguna menganalisis hubungan antara pelbagai pembolehubah dan membuat keputusan perdagangan berdasarkan analisis regresi. Melaraskan pekali dan parameter boleh memperhalusi prestasi model mengikut keadaan pasaran tertentu.
Ringkasan
Ulasan pelanggan
5 | 100 % | |
4 | 0 % | |
3 | 0 % | |
2 | 0 % | |
1 | 0 % |