
Penerangan
🎯 PRO SNIPER [Algotrend] — Panduan Lengkap & Ulasan Profesional
📋 SENARAI KANDUNGAN
- Gambaran Keseluruhan
- Bagaimana Ia Berfungsi — Seni Bina Isyarat
- Enjin Skor Konfluens (10 Faktor)
- Parameter — Panduan Terperinci untuk Setiap Tetapan
- Auto-Presets — Jadual Perbandingan
- Sistem Penarafan (A+, A, B, C)
- Pengurusan Risiko — SL, TP & Trailing
- Papan Pemuka & Penjejak Backtest
- Petua Penggunaan Praktikal
- Kekuatan & Had
1. 🔭 GAMBARAN KESELURUHAN
Pro Sniper adalah penunjuk lapisan multi-konfluens yang direka untuk menghasilkan isyarat Long dan Short yang sangat boleh dipercayai. Ia tidak bergantung pada satu penunjuk sahaja — sebaliknya, ia menggabungkan 10 faktor teknikal berbeza ke dalam skor konfluens yang berkisar dari 0 hingga 10. Isyarat hanya akan diaktifkan apabila skor melebihi ambang minimum yang ditetapkan.
Konsep asasnya mudah tetapi berkuasa: satu penunjuk sahaja (contohnya RSI dalam zon terlebih jual) boleh menghasilkan isyarat palsu. Tetapi apabila RSI, MACD, EMA, VWAP, Volume, ADX, dan trend jangka masa lebih tinggi semua menunjukkan arah yang sama serentak, kebarangkalian perdagangan berjaya meningkat dengan ketara.
Penunjuk ini juga termasuk sistem pengurusan perdagangan lengkap dengan 3 tahap Take Profit, Stop Loss struktur, dan trailing stop automatik, serta penjejak backtest terbina dalam yang memaparkan statistik prestasi sejarah secara masa nyata.
2. ⚙️ BAGAIMANA IA BERFUNGSI — SENI BINA ISYARAT
Isyarat Pro Sniper lahir daripada pertemuan 6 syarat serentak:
Syarat 1 — Persilangan EMA 🔀 EMA Pantas mesti melintasi EMA Perlahan. Persilangan ke atas = calon Long, persilangan ke bawah = calon Short. Tanpa persilangan ini, tiada isyarat boleh diaktifkan. Ini adalah "pencetus" asas.
Syarat 2 — Momentum 📈 Untuk Long, harga mesti di atas kedua-dua EMA Pantas dan EMA Perlahan. Untuk Short, di bawah kedua-duanya. Ini menapis persilangan palsu di mana harga "terperangkap" antara dua purata bergerak.
Syarat 3 — Penapis RSI 📊 RSI tidak boleh berada dalam zon ekstrem: untuk Long, mesti di bawah 75 (tidak terlebih beli), untuk Short di atas 25 (tidak terlebih jual). Ini mengelakkan kemasukan apabila momentum sudah habis.
Syarat 4 — Skor Minimum 🏆 Skor konfluens (0 hingga 10, dikira merentasi 10 faktor) mesti mencapai ambang minimum yang ditetapkan. Dengan preset Default, sekurang-kurangnya 5/10 diperlukan.
Syarat 5 — Penapis Gred 🏅 Isyarat mesti lulus penapis kualiti yang dipilih (Semua, A+/A, atau Hanya A+).
Syarat 6 — Arah 🚫 Isyarat berturut-turut dalam arah yang sama tidak dijana. Selepas Long, isyarat seterusnya hanya boleh Short (atau Long baru selepas SL dicapai dan arah diset semula).
3. 🧮 ENJIN SKOR KONFLUENS
Jantung penunjuk ini adalah enjin skorannya. Untuk setiap bar, kedua-dua bullScore dan bearScore dikira, masing-masing terdiri daripada 10 faktor:
Untuk Isyarat LONG (Skor Bull):
#FaktorSyaratBerat
1
📈 Arah EMA
EMA Pantas > EMA Perlahan
+1.0
2
📊 Trend Makro
Harga > Trend EMA (jangka masa panjang)
+1.0
3
💪 Momentum RSI
RSI antara 50 dan 75 (momentum positif, tidak habis)
+1.0
4
📉 Histogram MACD
Histogram MACD > 0
+1.0
5
🔀 Persilangan MACD
Garis MACD > Garis Isyarat
+1.0
6
⚖️ Posisi VWAP
Harga > VWAP (harga purata berwajaran volum)
+1.0
7
📦 Volum
Volum semasa > SMA(20) × 1.2 (volum melebihi purata)
+1.0
8
🎯 ADX + DI
ADX > 20 dan DI+ > DI- (trend kuat ke arah yang betul)
+1.0
9
🌐 Bias HTF
EMA Pantas > EMA Perlahan pada jangka masa lebih tinggi
+1.5
10
✨ Harga vs Pantas
Harga > EMA Pantas (pengesahan tambahan)
+0.5
Skor teori maksimum: 10.0 mata
Berat tidak sama rata di semua faktor. Bias jangka masa lebih tinggi (HTF) bernilai 1.5 mata kerana ia adalah penapis paling penting: berdagang bertentangan dengan trend makro adalah punca utama kerugian. Faktor "Harga vs EMA Pantas" hanya bernilai 0.5 kerana ia adalah pengesahan kecil.
Untuk isyarat SHORT (Skor Bear), logiknya adalah cermin: EMA Pantas < Perlahan, harga di bawah Trend EMA, RSI antara 25 dan 50, MACD negatif, dan lain-lain.
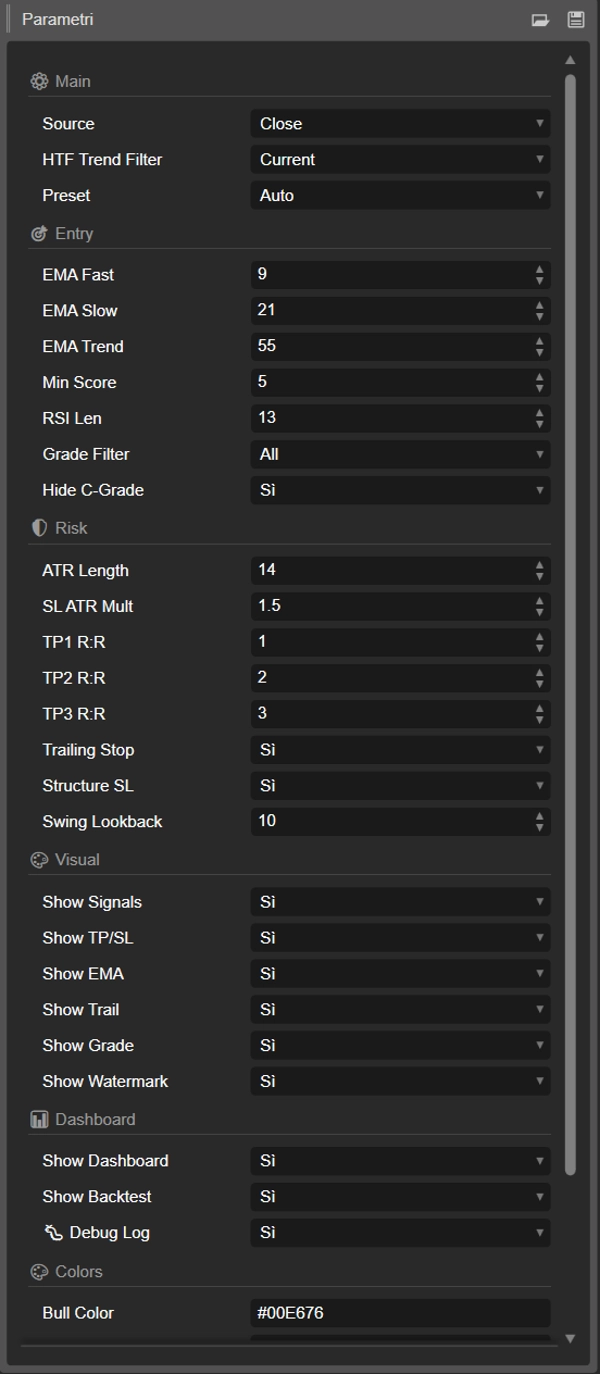
4. 📖 PARAMETER — PANDUAN TERPERINCI
⚙️ KUMPULAN: Tetapan Utama
🔹 Sumber (Default: Close) Siri harga yang digunakan untuk semua pengiraan (EMA, RSI, MACD). Pilihan: Close, Open, High, Low, Median (HL/2), Typical (HLC/3), Weighted ((H+L+2C)/4). Dalam kebanyakan kes, Close adalah pilihan terbaik. Typical berguna pada instrumen sangat volatil kerana ia melicinkan data sedikit.
🔹 Penapis Trend HTF (Default: Current) Jangka masa lebih tinggi yang digunakan untuk mengira bias trend makro. Apabila ditetapkan kepada "Current," ia menggunakan jangka masa yang sama dengan carta. Konfigurasi disyorkan: jika berdagang pada M5-M15 gunakan H1, jika berdagang pada H1 gunakan H4, jika berdagang pada H4 gunakan Daily. Penapis ini bernilai 1.5 mata dalam skor dan direka untuk mengelakkan perdagangan bertentangan dengan trend dominan. Data HTF menggunakan bar yang disahkan sebelumnya untuk mengelakkan cat semula.
🔹 Preset (Default: Auto) Memilih profil yang telah dikonfigurasi terlebih dahulu yang secara automatik menetapkan semua parameter dalam kumpulan Entry dan Risk. Dengan "Auto," preset dipilih berdasarkan jangka masa carta: M1-M5 → Scalping, M6-H1 → Default, H2-H4 → Aggressive, D1+ → Swing. Memilih "Custom" membolehkan anda mengubah setiap parameter secara manual.
🎯 KUMPULAN: Enjin Masuk
🔹 EMA Pantas (Default: 9 | Julat: 3-50) Tempoh purata bergerak eksponen pantas. Nilai lebih rendah (5-8) menjadikannya lebih responsif kepada pergerakan harga, menghasilkan lebih banyak persilangan tetapi dengan lebih banyak bunyi. Nilai lebih tinggi (12-15) menjadikannya lebih perlahan tetapi isyarat lebih boleh dipercayai. Ditimpa oleh preset yang dipilih (kecuali dengan "Custom"). Nilai mengikut preset: Scalping=5, Aggressive=8, Default=9, Conservative=12, Swing=13.
🔹 EMA Perlahan (Default: 21 | Julat: 10-100) Tempoh EMA perlahan. Bersama dengan EMA Pantas membentuk "pita" yang kelihatan pada carta. Persilangan antara Pantas dan Perlahan adalah pencetus asas untuk setiap isyarat. Jarak antara dua tempoh mempengaruhi kekerapan persilangan: tempoh lebih dekat (contoh 9/18) menghasilkan lebih banyak isyarat; tempoh lebih jauh (contoh 13/34) menghasilkan isyarat kurang tetapi pada pergerakan lebih signifikan. Nilai mengikut preset: Scalping=13, Aggressive=18, Default=21, Conservative=26, Swing=34.
🔹 Trend EMA (Default: 55 | Julat: 20-200) EMA jangka panjang yang menentukan trend makro. Harga di atas EMA ini menunjukkan konteks bullish, di bawah menunjukkan bearish. Dilukis pada carta sebagai garis kelabu putus-putus. Nilai tipikal adalah 50, 55, 89 (nombor Fibonacci), 100, atau 200. Nilai mengikut preset: Scalping=34, Default=55, Conservative/Swing=89.
🔹 Skor Min (Default: 5 | Julat: 1-10) Ambang konfluens minimum yang diperlukan untuk menghasilkan isyarat. Ini adalah parameter paling berpengaruh pada keseluruhan penunjuk. Nilai 3 menghasilkan banyak isyarat (lebih banyak perdagangan, lebih banyak bunyi). Nilai 7 menghasilkan sangat sedikit isyarat tetapi sangat ditapis. Hubungan tidak linear: naik dari 5 ke 7 boleh mengurangkan isyarat sebanyak 70-80%. Nilai mengikut preset: Scalping=4, Aggressive=3, Default=5, Swing=6, Conservative=7.
🔹 Panjang RSI (Default: 13 | Julat: 5-30) Tempoh Relative Strength Index. Tempoh lebih pendek (8-10) menjadikan RSI lebih sensitif dan responsif, berguna untuk scalping. Tempoh lebih panjang (14-21) menjadikannya lebih stabil, sesuai untuk swing trading. RSI tidak digunakan sebagai isyarat langsung tetapi menyumbang +1.0 kepada skor jika berada dalam zon yang betul (50-75 untuk Long, 25-50 untuk Short) dan bertindak sebagai penapis (menghalang Long jika RSI > 75, menghalang Short jika RSI < 25).
🔹 Penapis Gred (Default: Semua) Menapis isyarat mengikut gred kualiti (lihat bahagian Penarafan). "Semua" menunjukkan setiap isyarat sah. "A+ dan A" menunjukkan hanya isyarat dengan skor ≥ 6.5. "Hanya A+" menunjukkan hanya isyarat dengan skor ≥ 8.0. Penapis ini digunakan DI ATAS Skor Min. Contoh: jika anda menggunakan preset Aggressive (minScore=3) dengan Penapis Gred "Hanya A+", isyarat dengan skor 3-7.9 masih akan ditapis keluar.
🔹 Sembunyikan Gred C (Default: true) Apabila diaktifkan, menyembunyikan isyarat dengan skor < 5.0 (gred C). Berguna dengan preset ambang rendah (Aggressive, Scalping) untuk mengelakkan isyarat berkualiti rendah. Tiada kesan apabila Penapis Gred sudah ditetapkan kepada "A+" atau "A+ dan A" kerana ambang tersebut sudah di atas 5.0.
🛡️ KUMPULAN: Pengurusan Risiko
🔹 Panjang ATR (Default: 14 | Julat: 5-50) Tempoh Average True Range, yang mengukur volatiliti purata instrumen. Digunakan untuk mengira jarak Stop Loss dan, secara tidak langsung, tahap Take Profit. ATR 14 tempoh adalah standard industri. Nilai lebih pendek (10) bertindak balas lebih cepat kepada perubahan volatiliti. Nilai mengikut preset: Scalping=10, Default=14, Swing/Crypto=20.
🔹 Pengganda SL ATR (Default: 1.5 | Julat: 0.5-5.0) Pengganda ATR untuk pengiraan Stop Loss. SL diletakkan pada jarak = ATR × nilai ini dari masuk. Contoh: jika ATR = 100 pips dan pengganda 1.5, SL adalah 150 pips dari masuk. Nilai ketat (0.8-1.2) memberi risiko kurang per perdagangan tetapi lebih banyak stop-out. Nilai luas (2.0-3.0) memberi ruang lebih untuk perdagangan tetapi risiko lebih tinggi. Nilai mengikut preset: Scalping=0.8, Aggressive=1.2, Default=1.5, Conservative=2.0, Swing=2.5.
🔹 TP1 R:R (Default: 1.0 | Julat: 0.5-5.0) Tahap Take Profit pertama, dinyatakan sebagai gandaan risiko. Dengan TP1=1.0, sasaran adalah pada jarak sama dengan SL dari masuk (nisbah risiko-ganjaran 1:1). Jika SL 150 pips jauhnya, TP1 adalah pada 150 pips keuntungan. Ini adalah sasaran "ambil keuntungan separa" — yang paling mungkin dicapai.
🔹 TP2 R:R (Default: 2.0 | Julat: 1.0-8.0) Take Profit kedua. Dengan TP2=2.0, sasaran adalah dua kali jarak SL. Mewakili titik yang baik untuk menutup sebahagian lagi posisi. Jika trailing aktif, apabila mencapai TP2, stop dipindahkan ke tahap TP1 (mengunci keuntungan).
🔹 TP3 R:R (Default: 3.0 | Julat: 1.5-12.0) Take Profit ketiga dan terakhir — "pelari." Dengan TP3=3.0, sasaran adalah tiga kali jarak SL. Mencapai TP3 kurang kerap tetapi sangat menguntungkan. Mewakili perdagangan yang "lari" jauh ke arah yang betul.
🔹 Trailing Stop (Default: true) 🔄 Apabila aktif, SL secara progresif dipindahkan apabila TP dicapai: selepas TP1 → SL bergerak ke titik pulang modal (harga masuk). Selepas TP2 → SL bergerak ke tahap TP1. Selepas TP3 → SL bergerak ke tahap TP2. Mekanisme ini "mengunci" keuntungan dan menjadikan sebahagian perdagangan bebas risiko. Sangat disyorkan untuk kekal aktif.
🔹 Struktur SL (Default: true) 🏗️ Apabila aktif, Stop Loss diletakkan di bawah/atas swing low/high terkini dan bukannya pada jarak ATR tulen. Penempatan ini lebih realistik kerana SL berada di belakang tahap sokongan/rintangan struktur. Penunjuk memilih tahap yang lebih baik antara stop ATR dan stop struktur, dengan jarak minimum dijamin 0.5×ATR untuk mengelakkan stop terlalu ketat.
🔹 Swing Lookback (Default: 10 | Julat: 3-30) Bilangan bar untuk melihat ke belakang bagi swing low/high terkini, digunakan oleh Struktur SL. Dengan 10, penunjuk mencari minimum/maksimum 10 bar terakhir. Nilai lebih tinggi (15-20) mencari tahap struktur lebih signifikan tetapi mungkin lebih jauh, meningkatkan risiko per perdagangan.
🎨 KUMPULAN: Tetapan Visual
🔹 Tunjukkan Isyarat (Default: true) — Menunjukkan/menyembunyikan anak panah dan label "Long"/"Short" pada carta.
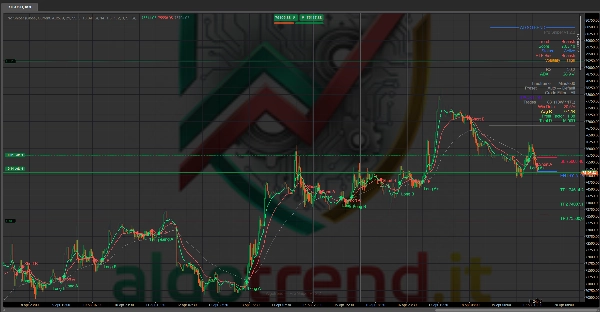
🔹 Tunjukkan TP/SL (Default: true) — Menunjukkan/menyembunyikan garis mendatar untuk Entry (biru), Stop Loss (merah), TP1/TP2/TP3 (hijau putus-putus), dan teks yang sepadan. Tahap yang dicapai bertukar menjadi warna teal dengan tanda ✓.
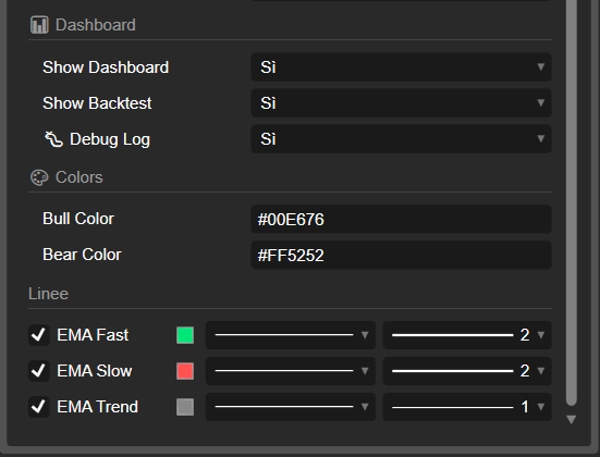
🔹 Tunjukkan EMA (Default: true) — Menunjukkan/menyembunyikan tiga garis EMA (Pantas=hijau, Perlahan=merah, Trend=kelabu putus-putus).
🔹 Tunjukkan Trail (Default: true) — Menunjukkan/menyembunyikan garis trailing stop (oren, putus-putus) apabila trailing aktif dan telah bergerak dari tahap SL asal.
🔹 Tunjukkan Gred (Default: true) — Menambah gred kualiti (A+, A, B, C) pada label isyarat. Contoh: "Long A+" atau "Short B."
🔹 Tunjukkan Tanda Air (Default: true) — Memaparkan teks "Algotrend — ProSniper v1.2.2" di tengah bawah carta.
📊 KUMPULAN: Papan Pemuka
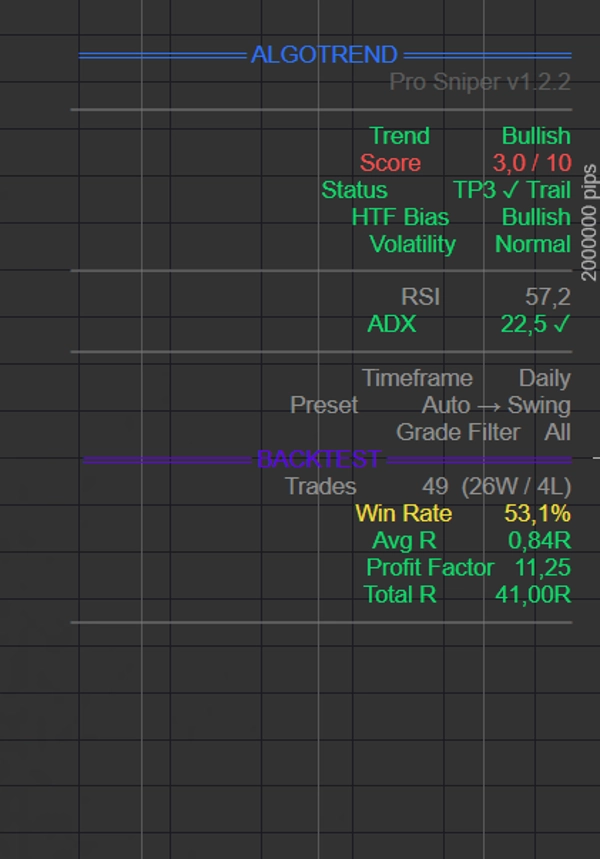
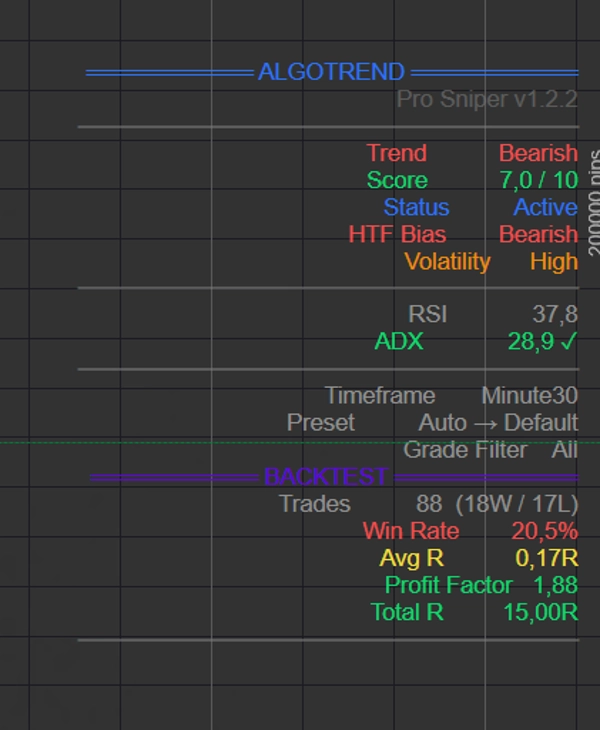
🔹 Tunjukkan Papan Pemuka (Default: true) — Memaparkan panel maklumat di sudut kanan atas dengan: Trend semasa, Skor, Status Perdagangan, Bias HTF, Volatiliti, RSI, ADX, Jangka Masa, Preset aktif, Penapis Gred, dan Versi.
🔹 Tunjukkan Backtest (Default: true) — Memaparkan panel statistik di bawah papan pemuka. Termasuk: jumlah perdagangan ditutup (Menang / Kalah), Peratusan Kadar Menang, Purata R (pulangan purata per perdagangan), Faktor Keuntungan (nisbah keuntungan/kerugian), dan jumlah terkumpul Total R. Warna panel berubah secara dinamik: 🟢 hijau jika Total R positif (keuntungan bersih), 🔴 merah jika negatif (kerugian bersih), 🟡 kuning pada titik pulang modal, ⚪ kelabu tanpa perdagangan.
🔹 Log Debug (Default: false) 🐛 — Mengaktifkan log diagnostik dalam konsol Log cTrader. Berguna untuk penyelesaian masalah: menunjukkan setiap persilangan EMA yang dikesan dengan butiran syarat penuh (skor, momentum, RSI, gred, arah), setiap isyarat yang dijana, dan ringkasan akhir. Harus dimatikan semasa penggunaan biasa untuk mengelakkan log menjadi sesak.
🎨 KUMPULAN: Warna
🔹 Warna Bull (Default: #00E676) — Warna untuk isyarat Long, EMA Pantas, dan anak panah bullish. Hijau terang yang jelas pada latar gelap.
🔹 Warna Bear (Default: #FF5252) — Warna untuk isyarat Short, EMA Perlahan, dan anak panah bearish. Merah karang yang jelas pada latar gelap.
5. 📊 PRESET — JADUAL PERBANDINGAN
Setiap preset secara automatik mengkonfigurasi 7 parameter. Berikut adalah perbandingan lengkap:
Parameter🏎️ Scalping⚡ Aggressive⚖️ Default🛡️ Conservative📅 Swing🌐 Crypto 24/7
EMA Pantas
5
8
9
12
13
9
EMA Perlahan
13
18
21
26
34
21
Trend EMA
34
50
55
89
89
55
Panjang RSI
8
11
13
14
21
14
Panjang ATR
10
12
14
14
20
20
Skor Min
4
3
5
7
6
5
Pengganda SL
0.8×
1.2×
1.5×
2.0×
2.5×
2.0×
Bila menggunakan preset mana:
🏎️ Scalping — Jangka masa M1-M5. Isyarat pantas, stop ketat, banyak perdagangan. Memerlukan perhatian berterusan dan spread rendah. Sesuai untuk indeks dan forex utama pada M1-M5.
⚡ Aggressive — Jangka masa M5-M30. Banyak isyarat (minScore=3), sesuai untuk mereka yang mahu lebih peluang dan menapis secara manual. Risiko: lebih banyak isyarat palsu.
⚖️ Default — Jangka masa M15-H1. Seimbang antara kekerapan dan kebolehpercayaan. Titik permulaan yang disyorkan untuk kebanyakan pedagang.
🛡️ Conservative — Jangka masa H1-H4. Sangat sedikit isyarat (minScore=7), tetapi berkualiti tinggi. Stop luas memberi ruang lebih untuk bernafas. Sesuai untuk mereka yang tidak dapat memantau carta secara berterusan.
📅 Swing — Jangka masa H4-D1. Direka untuk perdagangan yang berlangsung berhari-hari. EMA perlahan (13/34/89), stop sangat luas (2.5×ATR). Sedikit isyarat setiap minggu.
🌐 Crypto 24/7 — Seperti Default tetapi dengan ATR dan SL lebih luas untuk mengendalikan volatiliti 24 jam pasaran kripto. Tiada bias sesi.
6. 🏅 SISTEM PENARAFAN
Setiap isyarat menerima gred berdasarkan skor konfluensnya:
GredSkor DiperlukanMaksud
🥇 A+
≥ 8.0 / 10
Luar biasa — konfluens maksimum, semua penunjuk selari
🥈 A
≥ 6.5 / 10
Baik — kebanyakan faktor mengesahkan perdagangan
🥉 B
≥ 5.0 / 10
Sederhana — konfluens mencukupi tetapi tidak kuat
❌ C
< 5.0 / 10
Lemah — banyak faktor tidak mengesahkan, risiko tinggi
Gred dipaparkan di sebelah isyarat pada carta (contoh "Long A+" atau "Short B") dan boleh digunakan untuk menapis isyarat melalui Penapis Gred.
Isyarat A+ pada jangka masa H1 dengan preset Default bermaksud sekurang-kurangnya 8 daripada 10 faktor menunjukkan arah yang sama, termasuk bias HTF (1.5 mata). Jenis setup ini jarang tetapi secara sejarah mempunyai kadar kejayaan yang sangat tinggi.
7. 🛡️ PENGURUSAN RISIKO — BAGAIMANA IA BERFUNGSI SECARA TERPERINCI
Pengiraan Stop Loss
Apabila isyarat diaktifkan, SL dikira dengan dua cara (jika Struktur SL diaktifkan):
- Stop ATR: Masuk ± (ATR × Pengganda SL). Contoh: Masuk=100, ATR=2, Pengganda=1.5 → SL Long = 97.0
- Stop Struktur: Swing Low Terkini − 0.2×ATR (untuk Long) atau Swing High + 0.2×ATR (untuk Short). Penampan 0.2×ATR mengelakkan SL duduk tepat pada tahap struktur (di mana pemburuan stop kerap berlaku).
Penunjuk memilih tahap yang lebih menguntungkan (lebih ketat) antara kedua-duanya, dengan jarak minimum dijamin 0.5×ATR.
Pengiraan Take Profit
TP dikira sebagai gandaan risiko (jarak Masuk ke SL):
Risiko = |Masuk − SL| TP1 = Masuk ± Risiko × Pengganda TP1 TP2 = Masuk ± Risiko × Pengganda TP2 TP3 = Masuk ± Risiko × Pengganda TP3
Trailing Stop — Urutan
Dengan trailing aktif, progresi adalah: SL Asal → TP1 dicapai → SL bergerak ke titik pulang modal → TP2 dicapai → SL bergerak ke TP1 → TP3 dicapai → SL bergerak ke TP2. Jika harga berundur selepas TP2 dan menyentuh TP1 (tahap trailing baru), perdagangan ditutup dengan keuntungan sama dengan TP1 dan bukannya kerugian.
Bagaimana Perdagangan Ditutup dalam Backtest
Perdagangan ditutup apabila: SL (atau trailing stop) dicapai, atau isyarat bertentangan diaktifkan. Keputusan dalam "R" bergantung pada berapa banyak TP dicapai sebelum penutupan. Dengan trailing aktif, jika SL dicapai selepas TP2, pulangan yang direkodkan adalah TP1 (kerana trail diparkir di situ), bukan TP2.
8. 📊 PABAN PEMUKA — MEMBACA DATA
Panel Utama
MedanMaksud
Trend
Bullish (EMA Pantas > Perlahan DAN harga > Trend EMA), Bearish (sebaliknya), atau Neutral
Skor
Skor konfluens semasa (untuk perdagangan terbuka, atau skor bull/bear maksimum)
Status
"Tiada Perdagangan", "Aktif", "TP1 ✓ Trail", "TP2 ✓ Trail", "TP3 ✓ Trail"
Bias HTF
Arah trend pada jangka masa lebih tinggi
Volatiliti
"Tinggi" (ATR > 1.3× purata), "Normal", "Rendah" (ATR < 0.7× purata)
RSI
Nilai RSI semasa
ADX
Nilai ADX semasa. ✓ = trend kuat (> 20)
Jangka Masa
Jangka masa carta semasa
Preset
Preset aktif. Jika Auto, menunjukkan "Auto → [preset yang diselesaikan]"
Penapis Gred
Penapis gred aktif
Versi
v1.2.2
Panel Backtest (berkod warna)
MedanMaksud
Perdagangan
Jumlah perdagangan ditutup (Menang / Kalah)
Kadar Menang
Peratusan perdagangan menang (sekurang-kurangnya TP1 dicapai)
Purata R
Pulangan purata per perdagangan dalam unit risiko. > 0.5R = baik
Faktor Keuntungan
Jumlah keuntungan / Jumlah kerugian. > 1.5 = baik, > 2.0 = cemerlang
Jumlah R
Jumlah pulangan terkumpul dalam unit risiko
9. 💡 PETUA PENGGUNAAN PRAKTIKAL
🔹 Mulakan dengan preset Default pada jangka masa M15 atau H1. Ia adalah titik permulaan yang paling seimbang.
🔹 Tetapkan Penapis Trend HTF satu tahap di atas jangka masa operasi anda: M15 → H1, H1 → H4, H4 → Daily. Bias HTF bernilai 1.5 mata dan membuat perbezaan besar dalam kualiti isyarat.
🔹 Jangan turunkan Skor Min di bawah 4 tanpa sebab yang kukuh. Isyarat di bawah 4/10 mempunyai konfluens yang tidak mencukupi.
🔹 Gunakan Penapis Gred "A+ dan A" jika anda mahu kualiti melebihi kuantiti. Anda akan mendapat isyarat yang lebih sedikit tetapi setiap perdagangan akan mempunyai sekurang-kurangnya 6-7 faktor yang selari.
🔹 Kekalkan Trailing Stop aktif. Ia secara sistematik menukar perdagangan menang menjadi operasi bebas risiko selepas TP1.
🔹 Periksa Backtest sebelum berdagang. Jika panel berwarna merah pada instrumen/jangka masa anda, pertimbangkan untuk menukar preset atau jangka masa sebelum mempertaruhkan modal sebenar.
🔹 Dalam pasaran yang bergerak mendatar (ADX < 20, Volatiliti "Rendah"), isyarat kurang boleh dipercayai. ADX dalam papan pemuka memberitahu anda ini secara masa nyata.
🔹 Untuk Crypto, gunakan preset "Crypto 24/7" yang mempunyai stop lebih luas untuk mengendalikan jurang dan volatiliti semalaman.
🔹 Log Debug berguna jika isyarat yang dijangka tidak diaktifkan. Aktifkan, muat semula carta, dan periksa dalam Log syarat mana yang menghalang isyarat.
10. ⚖️ KEKUATAN & HAD
✅ Kekuatan
Multi-konfluens sebenar — 10 faktor bebas, bukan hanya penunjuk bertindih. Setiap faktor menangkap aspek berbeza pasaran (trend, momentum, volum, volatiliti, jangka masa lebih tinggi).
Preset pintar — Sistem Auto memilih parameter optimum untuk jangka masa, menghapuskan keperluan pengoptimuman manual untuk kebanyakan pengguna.
Pengurusan risiko terintegrasi — SL struktur + trailing automatik + 3 tahap TP menawarkan pengurusan perdagangan profesional tanpa perlu alat luaran.
Backtest masa nyata — Anda boleh menilai dengan segera sama ada penunjuk berfungsi pada instrumen anda sebelum mempertaruhkan modal.
HTF tidak cat semula — Bias jangka masa lebih tinggi menggunakan bar yang disahkan sebelumnya, mengelakkan isyarat yang berubah secara retrospektif.
Penarafan telus — Anda boleh melihat dengan tepat mengapa isyarat adalah A+ atau B dengan melihat skor dan faktor dalam papan pemuka.
⚠️ Had
Bukan sistem automatik — Ia adalah penunjuk, bukan bot. Isyarat harus disahkan secara visual oleh pedagang. Ia tidak membuka atau menutup perdagangan.
Backtest dipermudahkan — Menganggap masuk pada penutupan bar dan tidak mengambil kira slippage, komisen, atau spread. Keputusan sebenar akan sedikit lebih buruk.
VWAP anggaran — Dalam cTrader, VWAP dikira menggunakan Volum Tick (bukan volum sebenar), menjadikannya kurang tepat pada instrumen OTC seperti Forex.
Prestasi kurang baik dalam julat — Seperti semua penunjuk berasaskan persilangan EMA, ia menghasilkan isyarat palsu dalam pasaran tanpa trend, bergerak mendatar.
Trailing boleh mengehadkan keuntungan — Dalam trend sangat kuat, trailing stop mungkin menutup perdagangan terlalu awal. Tanpa trailing, perdagangan mencapai TP3 merekod +3R; dengan trailing, jika SL dicapai selepas TP3, pulangan yang direkodkan adalah +2R (kerana trail diparkir di TP2).
📌 Dokumen dijana untuk Pro Sniper v1.2.2 — Port cTrader Kemas kini terakhir: April 2026
Ringkasan
Key features include:
- Signal architecture based on six conditions including EMA crossover, momentum filters, RSI limits, minimum confluence score, quality grading, and directional control to avoid consecutive same-direction signals.
- A confluence scoring engine that weights factors differently, with higher importance on higher-timeframe bias.
- Integrated trade management with three configurable Take Profit levels, structural Stop Loss placement considering recent swing points, and automatic trailing stops to lock in profits.
- Multiple presets tailored for various trading styles and timeframes, from scalping (M1-M5) to swing trading (H4-D1) and a crypto-specific preset for 24/7 markets.
- A dashboard displaying real-time trend, score, trade status, volatility, RSI, ADX, and backtest statistics including win rate and profit factor.
- Visual customization options for signals, EMAs, stops, and grading labels.
The indicator does not automate trade execution but provides comprehensive signals and risk management tools for manual trading decisions. It supports trend analysis and risk control across multiple markets and timeframes.
Ulasan pelanggan
5 | 0 % | |
4 | 100 % | |
3 | 0 % | |
2 | 0 % | |
1 | 0 % |


