Penerangan
Buih Isipadu – Penunjuk Tersuai cTrader
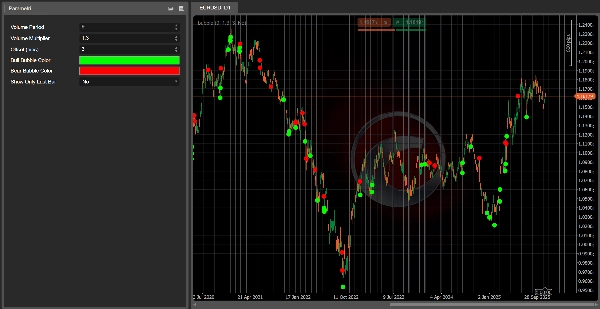
Buih Isipadu adalah penunjuk visual yang ringan tetapi berkuasa untuk cTrader yang menyerlahkan lilin dengan isipadu luar biasa terus pada carta harga.
Daripada menatap histogram isipadu dan cuba meneka bar mana yang benar-benar penting, alat ini secara automatik mengesan apabila isipadu lilin semasa jauh lebih tinggi daripada purata terkini dan melukis buih (ikon bulatan) pada bar tersebut:
- Untuk lilin menaik, buih dilukis di bawah paras rendah lilin.
- Untuk lilin menurun, buih dilukis di atas paras tinggi lilin.
Ini memudahkan untuk mengenal pasti pergerakan klimaks yang berpotensi, kawasan minat kuat dari pemain besar, atau kemungkinan titik keletihan dalam trend.
Ciri-ciri Utama
- ✅ Mengesan lilin berisipadu tinggi menggunakan Purata Pergerakan isipadu tick
- ✅ Melukis buih jelas pada carta (tiada subwindow tambahan diperlukan)
- ✅ Warna berbeza untuk lilin menaik dan lilin menurun dengan lonjakan isipadu
- ✅ Laras offset dalam pips untuk meletakkan buih jauh dari lilin
- ✅ Pilihan untuk menunjukkan buih hanya pada bar terkini (untuk dagangan masa nyata)
Input / Parameter
- Tempoh Isipadu – Bilangan bar yang digunakan untuk purata pergerakan isipadu.
- Pendaraban Isipadu – Berapa kali lebih tinggi daripada isipadu purata bar mesti untuk mencetuskan buih.
- Offset (pips) – Jarak antara buih dan paras tinggi/rendah lilin.
- Warna Buih Bull – Warna buih pada lilin menaik.
- Warna Buih Bear – Warna buih pada lilin menurun.
- Tunjukkan Hanya Bar Terakhir – Jika benar, memaparkan buih hanya pada bar langsung semasa.
Cara Menggunakan
Tambah Buih Isipadu ke carta anda dan gunakan sebagai penapis visual untuk:
- Sahkan pecahan yang disokong oleh isipadu kuat
- Kenal pasti pembalikan yang mungkin atau lilin keletihan
- Kenal pasti zon di mana pemain besar mungkin aktif
Ia bukan sistem dagangan berdiri sendiri, tetapi ia adalah alat pendamping yang sangat baik untuk mana-mana strategi tindakan harga atau mengikuti trend yang mengambil kira isipadu.
👉 Sertai di sini: Algotrendit Buih Isipadu
Di dalam pelayan anda akan menemui:
- Sokongan untuk cBots/penunjuk ini dan lain-lain
- Perbincangan strategi dan idea pengoptimuman
- Kemas kini, berita, dan alat masa depan yang saya keluarkan
Ringkasan
Key features include adjustable parameters such as the volume period for averaging, volume multiplier threshold, bubble offset in pips, and customizable colors for bullish and bearish volume spikes. Users can also choose to display bubbles only on the latest bar for real-time trading. The indicator integrates directly on the price chart without requiring additional subwindows.
Volume Bubbles serves as a visual filter to confirm breakouts supported by strong volume, spot possible reversals or exhaustion candles, and identify zones of significant market activity. It complements price action and trend-following strategies by providing volume-based insights across various markets including forex, indices, commodities, stocks, and cryptocurrencies.
Ulasan pelanggan
5 | 0 % | |
4 | 100 % | |
3 | 0 % | |
2 | 0 % | |
1 | 0 % |