
Opis
IR Open Connector
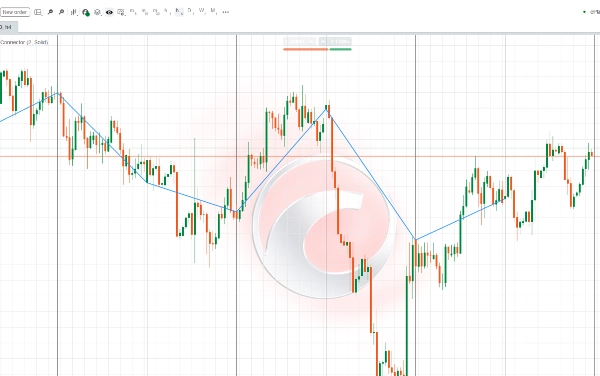
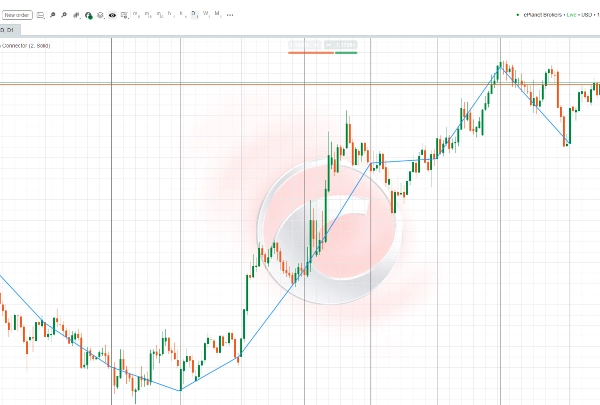
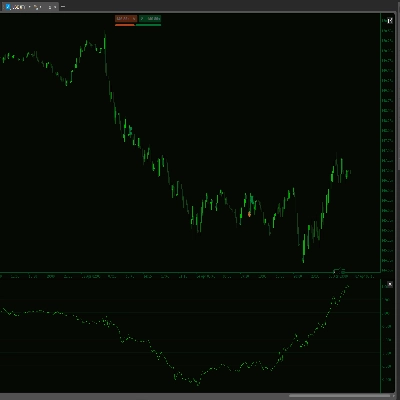
Ten wskaźnik został zaprojektowany, aby łączyć ceny otwarcia świec z wyższych interwałów czasowych, w zależności od aktualnego interwału wykresu:
- Jeśli interwał jest poniżej jednej godziny → łączy otwarcia świec dziennych.
- Jeśli interwał to 4 godziny → łączy otwarcia świec tygodniowych.
- Jeśli interwał jest wyższy niż 4 godziny, ale niższy niż tygodniowy → łączy otwarcia świec miesięcznych.
Pozwala to traderom wyraźnie wizualizować kluczowe poziomy otwarcia wyższych okresów (dziennych, tygodniowych, miesięcznych) bezpośrednio na ich wykresach. Poziomy te często służą jako krytyczne obszary wsparcia i oporu, potencjalne strefy inicjacji trendu oraz ważne punkty odniesienia w analizie rynku.
Kolor, grubość i styl linii są w pełni konfigurowalne, co daje Ci elastyczność dostosowania wyświetlania do Twojego osobistego stylu handlu.
این اندیکاتور طراحی شده تا نقاط باز شدن کندلهای تایمفریمهای بالاتر را بسته به تایمفریم فعلی شما به هم متصل کند:
- اگر تایمفریم کمتر از یک ساعت باشد → باز شدن کندلهای روزانه را به هم وصل میکند.
- اگر تایمفریم چهارساعته باشد → باز شدن کندلهای هفتگی را به هم وصل میکند.
- اگر تایمفریم بزرگتر از چهارساعته و کوچکتر از هفتگی باشد → باز شدن کندلهای ماهانه را به هم وصل میکند.
این ویژگی به معاملهگر کمک میکند تا به سادگی سطوح مهم شروع دورههای بزرگتر (روزانه، هفتگی، ماهانه) را روی نمودار مشاهده کند. این سطوح اغلب بهعنوان نقاط کلیدی حمایت و مقاومت، شروع روندهای جدید یا محدودههای معاملاتی مهم در نظر گرفته میشوند.
با تنظیم رنگ، ضخامت و نوع خط، میتوانید نمایش این خطوط را مطابق با سبک معاملاتی خود شخصیسازی کنید.


![Logo „[Hamster-Coder] Moving Average MTF”](https://cdn.ctrader.com/image/webp/b11b98b1-194d-4b8e-b00e-d611826ad159_31226)

