
present
Zarejestruj się i otrzymaj 50 $ zniżki na pierwszy zakup
Trading product for Market Bias Dashboard Wskaźnik Premium/Discount  Key Levels, image 1
Market Bias Dashboard
Wskaźnik
Wersja 1.0, Jul 2026
Windows, Mac
Trading product for Market Bias Dashboard Wskaźnik Premium/Discount  Key Levels, image 2
Trading product for Market Bias Dashboard Wskaźnik Premium/Discount  Key Levels, image 3
Trading product for Market Bias Dashboard Wskaźnik Premium/Discount  Key Levels, image 4

Opis

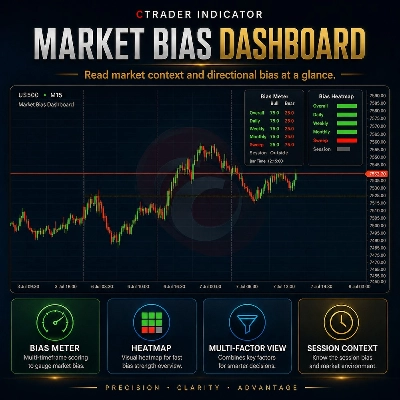
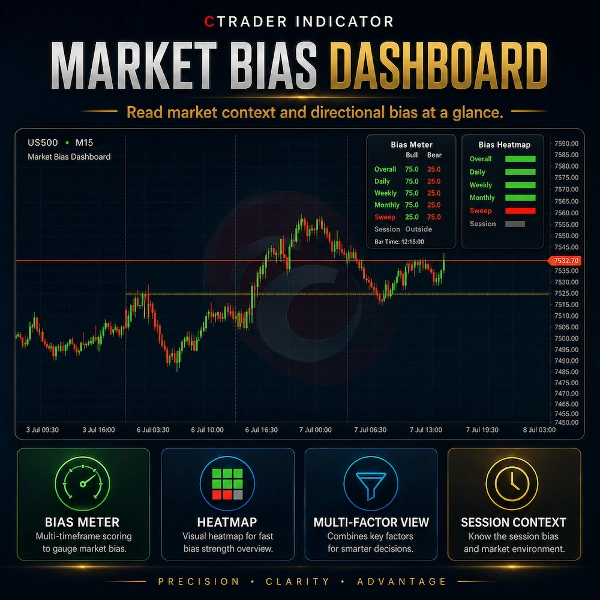
Market Bias Dashboard to wizualny wskaźnik cTrader zaprojektowany do podsumowywania kontekstu rynkowego bezpośrednio na Twoim wykresie.


Panel ocenia wybrane punkty odniesienia akcji cenowej, takie jak poziomy równowagi z poprzedniego dnia, poprzedniego tygodnia i poprzedniego miesiąca, status bieżącej sesji oraz ostatnio wykryty zasięg płynności. Wynik jest wyświetlany w przejrzystym układzie Bias Meter i Bias Heatmap.


Ważne: Wyświetlane wartości Bull/Bear nie są statystycznymi prawdopodobieństwami, danymi o nastrojach rynkowych na żywo ani prognozami skuteczności transakcji. Są to stałe wizualne stany kontekstu używane, aby ułatwić odczyt panelu.


Panel używa następującej logiki stanów:


Kontekst byczy: 75 / 25

Kontekst neutralny lub mieszany: 50 / 50

Kontekst niedźwiedzi: 25 / 75


Na przykład, jeśli cena jest powyżej wybranego poziomu równowagi, ten element może być pokazany jako kontekst byczy. Jeśli cena jest poniżej, może być pokazany jako kontekst niedźwiedzi. Jeśli kontekst jest niejasny, niedostępny lub mieszany, może być pokazany jako neutralny.


Główne cechy:

- Przejrzysty panel Bias Meter

- Panel Bias Heatmap

- Kontekst CE z poprzedniego dnia, tygodnia i miesiąca

- Widok kontekstu premii / dyskonta

- Status bieżącej sesji

- Opcjonalny kontekst zasięgu płynności

- Opcjonalne linie odniesienia

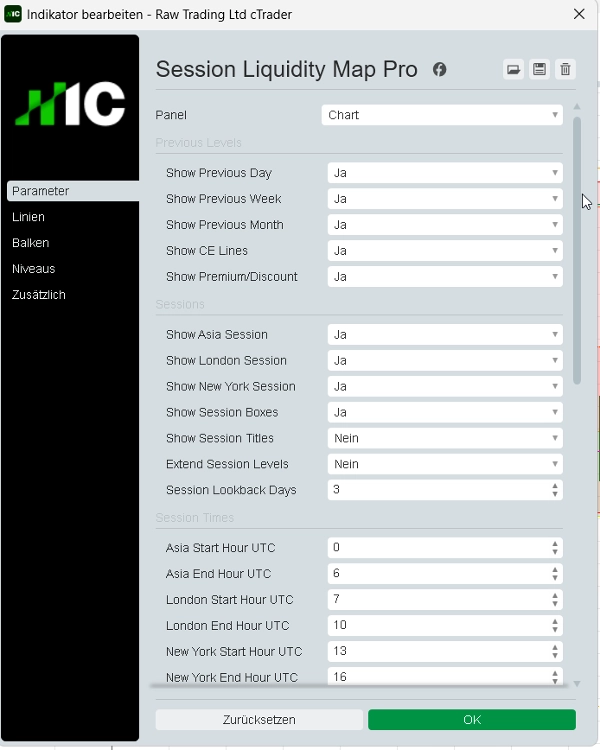
- Regulowana pozycja panelu

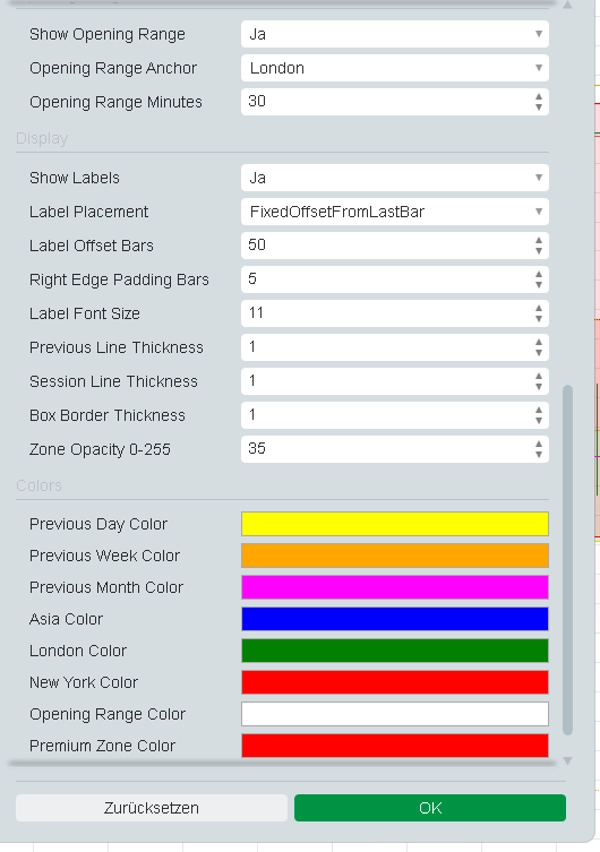
- Niestandardowe kolory i ustawienia wyświetlania

- Wskaźnik bezpieczny dla sklepu z ograniczonymi prawami dostępu


Market Bias Dashboard to wyłącznie narzędzie wizualizacji wykresu i kontekstu rynkowego. Nie wykonuje transakcji, nie modyfikuje zleceń i nie zapewnia gwarantowanych sygnałów kupna lub sprzedaży.


Trading wiąże się z ryzykiem. Ten wskaźnik nie udziela porad finansowych, rekomendacji inwestycyjnych, statystycznych prawdopodobieństw ani gwarantowanych wyników handlowych.


Podsumowanie

Podsumowanie AI
Market Bias Dashboard is a cTrader indicator that visually summarizes market context on your chart. It evaluates key price action reference points including previous day, week, and month equilibrium levels, current session status, and recent liquidity sweeps. These elements are presented through a Bias Meter and Bias Heatmap, indicating bullish, bearish, or neutral market states based on price positioning relative to equilibrium levels. The dashboard’s bias states use fixed visual values (bullish: 75/25, neutral: 50/50, bearish: 25/75) to simplify interpretation and do not represent probabilities or trading signals. Features include premium/discount context views, optional liquidity sweep indicators, adjustable panel positioning, customizable colors and display settings, and reference lines. The tool is designed solely for market context visualization and does not execute trades or provide financial advice. It supports analysis of trend strength and reversal signals using bar data and is categorized under trend indicators. Tags associated with the product highlight its focus on structure and smart money concepts such as key levels, liquidity grabs, and risk dashboards.
Profil wskaźnika
Kategoria wskaźnika
Trend
Typ wyjścia
Wizualizacja
Wymagania dotyczące danych
Tylko słupki
Obsługiwane sygnały
Odwrócenie trendu
Siła trendu

Opinie klientów

0.0
Opinie: 0
Opinie klientów
Ten produkt nie ma jeszcze opinii. Wypróbowałeś(-aś) go już? Bądź pierwszy(-a) i powiedz o tym innym!

Dyskusja

Częste pytania

Premium/Discount
Key Levels
Liquidity Sweep
Risk Dashboard
Liquidity Grab
Produkty dostępne za pośrednictwem cTrader Store, w tym boty handlowe, wskaźniki i wtyczki, dostarczane są przez deweloperów zewnętrznych i udostępniane wyłącznie w celach informacyjnych oraz w celu zapewnienia dostępu technicznego. cTrader Store nie jest brokerem i nie zapewnia doradztwa inwestycyjnego, nie udziela spersonalizowanych rekomendacji ani nie gwarantuje przyszłych wyników.

Więcej od tego autora

Wskaźnik
SMC
Prop
+5
Automatically draws the Opening Range (High & Low) for Tokyo, London, and New York sessions. Configurable start times,
Wskaźnik
Liquidity Grab
Liquidity Sweep
+2
Visualizes accumulation ranges, manipulation sweeps and distribution phases on your cTrader chart.
Wskaźnik
BOS
Key Levels
+2
Maps bullish and bearish order block zones, CE levels and structure-based price action context.
Wskaźnik
MSS
Key Levels
+2
Maps equal highs, equal lows and active liquidity pools directly on your cTrader chart.
Wskaźnik
BOS
MSS
+3
Maps BOS, CHoCH, swing breaks and market structure shifts directly on your cTrader chart.
Wskaźnik
EMA
RSI
+2
Compact premium cTrader dashboard for market bias, sessions, premium/discount context, liquidity direction, ADR range an
cBot
ATR
EMA
+4
Professional Supply & Demand Execution Bot for cTrader. CS Apex Hunter Pro is a fully automated execution bot designed
7.6%
ROI
3.17
Współczynnik zysku
Wskaźnik
SMC
Prop
+12
Killzone, ICT, SMC, Session, Asia, London, New York, NY PM, Session High, Session Low, Smart Money, Order Flow, Trading
Wskaźnik
MSS
Key Levels
+4
Maps session ranges, previous highs/lows, equilibrium and premium/discount zones on your cTrader chart.

Możesz także polubić

Wskaźnik
BOS
CHOCH
+5
MyZTrade High TF candle is a multi-timeframe visualisation tool that overlays completed higher-timeframe candles.
Wskaźnik
ATR
EMA
+5
The indicator displays potential reversal zones (support/resistance) on the chart based on the average range (High–Low)
Wskaźnik
Key Levels
Spots key hourly ranges and signals breakouts using arrows & colored background zones. Ideal for Gold.
Wskaźnik
AI
ATR
+20
Algorithmic trend precision for cTrader.
Wskaźnik
ATR
Channel
Reversal Trap Probability Bands plots a dynamic volatility envelope around price & automatically detects "trap" reversal
Wskaźnik
Prop
Forex
+11
🌊 See when the market is truly in play. Tsunami measures Relative Volume by time-of-day 🌊
Wskaźnik
Volume
Fibonacci
+3
Draw and manage multiple fixed-range volume profiles with persistent levels, developing POC/VA and smart alerts.
Wskaźnik
Shows BUY & SELL signals for 3 & 4 BAR PATTERN (Morning star/ Evening star). It is adjustable and it will SHOW ARROWS.
Wskaźnik
RSI
SMC
+17
RSI, MACD, Stochastic, CCI & Momentum divergence scanner with confluence scoring. Never miss a signal again!
Wskaźnik
ATR
SMC
+17
Adaptive Swing-Anchored VWAP that tracks market structure shifts with precision and clarity.
Logo „Two Candle Patterns ”
Najwyżej oceniane
4.5
(7)
$19
/
$35
Wskaźnik
Forex
Crypto
+3
Detect powerful 2-candle reversal patterns at key highs/lows. Boost entries with real-time alerts and visual signals.
Wskaźnik
Prop
Forex
+10
Support and Resistance Line Indicator with Higher Timeframe Filter
Wskaźnik
Forex
Detects valid Fair Value Gaps from strong 3-bar patterns. Keep drawing unfilled gaps until price fills them.
Wskaźnik
Engulfing
Fibonacci
+4
Six higher-timeframe candle sets on one chart, with liquidity sweep detection and swept levels.
Wskaźnik
Key Levels
Market Structure
+1
Sessions, ICT killzones, multi-ORB and previous levels. One clean, no-repaint cTrader overlay.
Wskaźnik
📊 Smart Floating Risk Pro – Advanced Risk Management for cTrader
Wskaźnik
Liquidity Grab
Liquidity Sweep
+1
CRT Sweep Tracker is an advanced panel for Candle Range Theory (CRT) traders to track HTF sweeps and manage live trades.
Logo „Oscillator Scanner”
Najwyżej oceniane
4.7
(4)
$20
/
$39
Wskaźnik
ATR
RSI
+7
Track the Movement of Market Assets with an Oscillator Scanner in Real-Time!

Cena

4
Sprzedaż
























