
Opis
Market Regime AI
Inteligentne wykrywanie stanu rynku dla precyzyjnego handlu
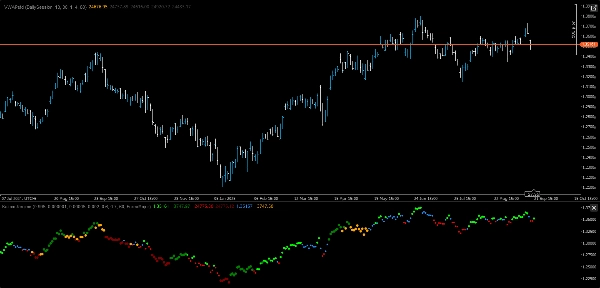
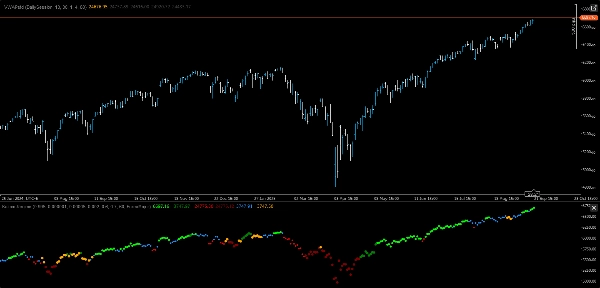
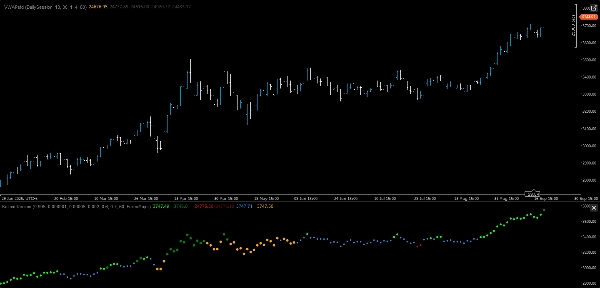
Market Regime AI to nowoczesny wskaźnik handlowy, który łączy AI i matematykę z adaptacyjną logiką, aby w czasie rzeczywistym klasyfikować rynek do jednego z sześciu możliwych do działania reżimów. Modelując jednocześnie trend cenowy i zmienność, dostarcza wyraźną, kolorową mapę aktualnego „nastroju” rynku — umożliwiając traderom natychmiastowy wybór odpowiedniej strategii.
Sześć reżimów, sześć kolorów, jeden inteligentny system
Reżim Kolor Nastrój rynku
------------------------ -------------------- -----------------------------------------------
Byczy – niska zmienność Limonkowy Płynny trend wzrostowy — idealny do pełnowymiarowego podążania za trendem
Byczy – wysoka zmienność Zielony Trend wzrostowy z turbulencjami — transakcje wybicia z ograniczonym ryzykiem
Niedźwiedzi – niska zmienność Czerwony Kontrolowany trend spadkowy — możliwości krótkiego podążania za trendem
Niedźwiedzi – wysoka zmienność Bordowy Ostre spadki — agresywne krótkie pozycje lub zabezpieczenia ochronne
Boczny – niska zmienność Dodger Blue Cicha konsolidacja — ustawienia odwrócenia do średniej
Boczny – wysoka zmienność Pomarańczowy Chaotyczny zakres — unikaj lub skalpuj z ciasnymi stopami
Kluczowe cechy
• Modelowanie AI w dwóch stanach: Śledzi zarówno trend, jak i zmienność dla bogatszych, bardziej wiarygodnych sygnałów.
• Ustawienia uwzględniające aktywa: Optymalizowane ustawienia dla głównych par Forex, egzotyków, złota i indeksów — natychmiastowa zmiana przez rozwijane menu.
• Wizualna przejrzystość: Kropki reżimu i opcjonalne cieniowanie tła sprawiają, że stany rynku są oczywiste na pierwszy rzut oka.
• Mapowanie strategiczne: Powiąż każdy reżim z konkretnymi stylami handlu, wielkością pozycji i kontrolą ryzyka.
• Redukcja szumów: Wygładza dane rynkowe, aby ujawnić prawdziwy stan bazowy, unikając fałszywych sygnałów.
Dlaczego jest wyjątkowy
Większość wskaźników skupia się na jednym wymiarze — trendzie lub zmienności. Market Regime AI integruje oba w jednolity, adaptacyjny model, dając traderom wielowarstwowy obraz warunków rynkowych. Oznacza to szybsze, mądrzejsze decyzje i strategie, które dostosowują się wraz ze zmianami rynku.
Scenariusze użycia
• Podążanie za trendem: Angażuj się w reżimy Byczy/Niedźwiedzi–NiskaZmienność z pełną wielkością.
• Handel wybiciami: Celuj w reżimy Byczy/Niedźwiedzi–WysokaZmienność dla gwałtownych ruchów.
• Odwrócenie do średniej: Wykorzystuj zakresy Boczny–NiskaZmienność.
• Skalowanie ryzyka: Zmniejsz ekspozycję w reżimach WysokaZmienność, aby chronić kapitał.
• Automatyczne przełączanie strategii: Przekazuj wyjście reżimu do cBots dla bezobsługowego handlu.
Podsumowanie
Opinie klientów
5 | 100 % | |
4 | 0 % | |
3 | 0 % | |
2 | 0 % | |
1 | 0 % |


