Opis
📈 pATR – Percentylowy Średni Rzeczywisty Zasięg
Precyzyjna Zmienność. Inteligentniejsze Ryzyko. Przewaga Instytucjonalna.
Wskaźnik pATR redefiniuje tradycyjny ATR, stosując filtr oparty na percentylach do ostatnich wartości rzeczywistego zasięgu, dając traderom statystycznie ugruntowany obraz zmienności. Zamiast polegać na prostych średnich, pATR oblicza n-ty percentyl intensywności ostatnich ruchów cen — pomagając z chirurgiczną precyzją identyfikować strefy wybicia, setupy fade i progi ryzyka.
Niezależnie od tego, czy stawiasz czoła wyzwaniom firm prop, czy doskonalisz strategię skalpowania, pATR dostarcza dynamiczny punkt odniesienia zmienności, który dostosowuje się do warunków rynkowych i utrzymuje kalibrację ryzyka.
🔍 Kluczowe Funkcje
• ATR oparty na percentylach: Filtruje szumy i zdarzenia ogonowe dla czystszych sygnałów zmienności
• Logika bufora kołowego: Optymalizowana pod kątem szybkości i efektywności pamięci — bez opóźnień, bez bałaganu
• Gotowy na tryb wyzwania: Idealny dla traderów firm prop zarządzających spadkami i limitami transakcji
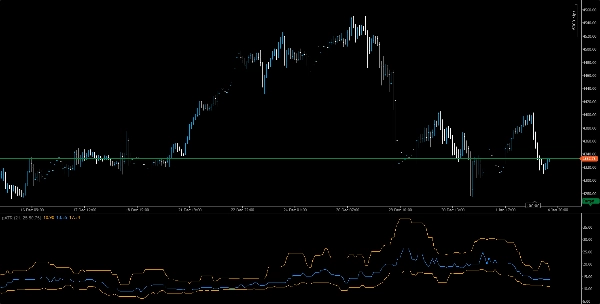
• Czysta wizualizacja: Pomarańczowa linia zmienności z intuicyjnym skalowaniem i opcjami nakładania
• Kompatybilny z wieloma ramami czasowymi: Używaj od M1 do H1 dla setupów wybicia, fade lub trendu
🧠 Zastosowania
• Potwierdzenie wybicia: Używaj skoków pATR do weryfikacji wejść z impetem
• Kalibracja ryzyka: Dopasuj stop-loss i wielkość pozycji do zmienności percentylowej
• Testowanie strategii:Weryfikuj setupy z użyciem spójnych progów zmienności
🎯 Dla kogo jest to przeznaczone
• Traderzy firm prop poszukujący regułowej kontroli ryzyka
• Skalperzy i strategowie intraday potrzebujący adaptacyjnych filtrów zmienności
• Traderzy ilościowi integrujący logikę percentylową w systemach niestandardowych
• Edukatorzy i mentorzy uczący wykonania z uwzględnieniem zmienności
Podsumowanie
Key features include an orange volatility line with intuitive scaling and overlay options, compatibility across multiple timeframes from 1-minute to 1-hour charts, and suitability for prop firm traders managing drawdowns and trade limits. pATR helps traders identify breakout zones, fade setups, and risk thresholds with precision.
Use cases cover breakout confirmation through volatility spikes, risk calibration by aligning stop-loss and position sizing with percentile volatility, and strategy backtesting using consistent volatility benchmarks. The indicator is designed for prop firm traders, scalpers, intraday strategists, quantitative traders integrating percentile logic, and educators focusing on volatility-aware execution.
Supported markets include Forex, stocks, indices, commodities, and cryptocurrencies, making pATR a versatile tool for various trading environments.