Açıklama
SC ADX Dots
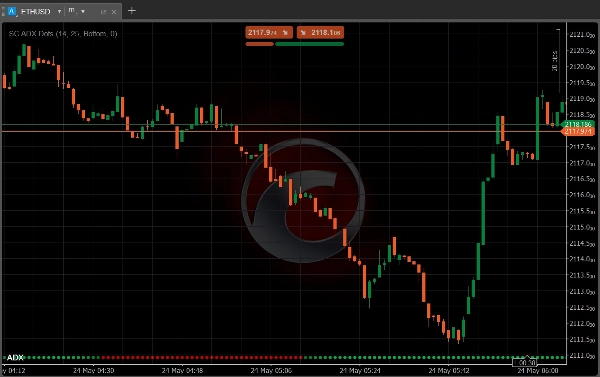
SC ADX Dots, gereksiz çizgilerle grafiği kalabalıklaştırmadan trend gücünün daha temiz ve sezgisel bir görünümünü sağlamak için tasarlanmış klasik ADX göstergesinin minimalist bir versiyonudur.
Geleneksel ADX çizgisini göstermek yerine, gösterge ADX değerini zaman içinde temsil etmek için dinamik noktalar kullanır.
Bu yaklaşım, özellikle birden fazla aracı aynı anda kullanan traderlar için okunması daha kolay, daha temiz ve modern bir grafik düzeni oluşturur.
Ana Özellikler
- Çizgiler yerine noktalar kullanılarak gösterilen ADX
- Daha temiz ve daha az dikkat dağıtan grafik görünümü
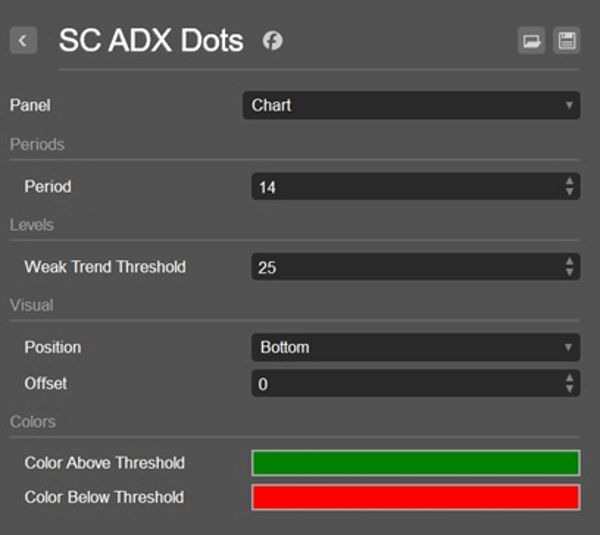
- İki farklı renk modu:
-
- ADX eşik değerinin altında olduğunda bir renk
- ADX eşik değerinin üzerinde olduğunda bir renk
- Renk yoğunluğu ADX gücüne göre dinamik olarak değişir
- Trend momentumunun hızlı görsel okunması
- Scalping, günlük işlem ve takdirli işlem için ideal
Neden SC ADX Dots Kullanılır
Geleneksel ADX göstergeleri, özellikle diğer göstergeler veya fiyat hareketi araçları ile birleştirildiğinde, grafiklerin kalabalık ve okunması zor görünmesine neden olabilir.
SC ADX Dots, tek bir amaçla yaratıldı:
grafiği görsel olarak temiz tutarken trend gücü hakkında tüm temel bilgileri sağlamaktır.
Uyarlanabilir nokta görselleştirmesi, traderların piyasa momentumunun artıp azaldığını anında fark etmelerini sağlar, ekran boyunca ekstra çizgilerin dikkat dağıtıcı etkisi olmadan.
Mükemmel İçin
- Temiz grafik tercih eden traderlar
- Fiyat hareketi traderları
- Scalperlar ve günlük traderlar
- Çoklu gösterge işlem düzenleri
- Hızlı piyasa analizi
Önemli Not
SC RSI Dots, ana fiyat grafiği üzerinde doğrudan kullanılmak üzere tasarlanmıştır.
Geleneksel RSI göstergelerinin aksine, görsel konsepti momentum bilgisini fiyat hareketi analizine entegre etmeye dayanır. Bu nedenle, göstergenin ayrı bir panelde kullanılması önerilmez ve amaçlanan kullanıcı deneyimini sağlamaz.
Basit. Temiz. Etkili.
Özet
Müşteri değerlendirmeleri
5 | 100 % | |
4 | 0 % | |
3 | 0 % | |
2 | 0 % | |
1 | 0 % |