present
Zarejestruj się i otrzymaj 50 $ zniżki na pierwszy zakup
Trading product for QuarterlyTheoryStrategy Wskaźnik Fair Value Gap BOS, image 1
QuarterlyTheoryStrategy
Wskaźnik
107 pobrania
Wersja 1.0, May 2026
Windows, Mac
4.0
Opinie: 2
Trading product for QuarterlyTheoryStrategy Wskaźnik Fair Value Gap BOS, image 2
Trading product for QuarterlyTheoryStrategy Wskaźnik Fair Value Gap BOS, image 3
Od 21/02/2025
466.3M
Wolumen transakcji
180.83K
Zysk w pipsach
26
Sprzedaż
7.43K
Bezpłatne instalacje

Opis

Quarterly Theory Indicator (ICT) — Strefy sesji i inteligentne sygnały

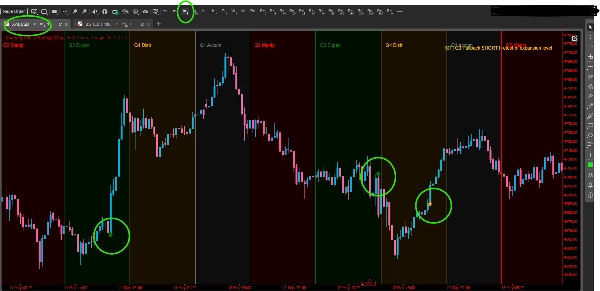
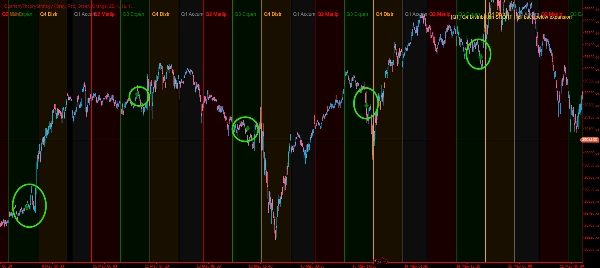
Wskaźnik Quarterly Theory Indicator przenosi ramy cyklu sesji ICT (Inner Circle Trader) bezpośrednio na wykres cTrader. Opierając się na koncepcji, że każdy 24-godzinny dzień handlowy jest podzielony na cztery odrębne 6-godzinne fazy, wskaźnik automatycznie identyfikuje i wizualizuje:

  • Q1 – Akumulacja (18:00–00:00 NY): Pozycje inteligentnych pieniędzy działają cicho
  • Q2 – Manipulacja (00:00–06:00 NY): Fałszywe ruchy i polowania na stop lossy
  • Q3 – Ekspansja (06:00–12:00 NY): Prawdziwy ruch kierunkowy
  • Q4 – Dystrybucja (12:00–18:00 NY): Realizacja zysków i odwrócenia


Kluczowe cechy

Tła stref sesji Każda ćwiartka jest zacieniona w pełni konfigurowalnym kolorze i oznaczona bezpośrednio na wykresie. Kolory, przezroczystość i grubość obramowania są w pełni regulowane. Strefy aktualizują się dynamicznie podczas przewijania i powiększania.

4 inteligentne sygnały wejścia

  • Q2 Stop-Hunt — wykrywa wybicia maksimów/minimów Q1, które zamykają się z powrotem wewnątrz, sygnalizując pułapkę i odwrócenie
  • Q3 Wejście ekspansji — aktywuje się, gdy cena wybija się z zakresu Q2, oznaczając prawdziwy ruch kierunkowy
  • Q3 Wejście po cofnięciu — identyfikuje testy poziomu wybicia ekspansji dla wejść o niższym ryzyku
  • Q4 Dystrybucja — ostrzega, gdy cena przechodzi z powrotem przez poziom ekspansji podczas fazy dystrybucji

Każdy sygnał jest rysowany jako strzałka kierunkowa (↑↓) bezpośrednio na słupku wykresu, na którym spełniony jest warunek.

Wbudowane alerty Podczas działania na żywym słupku wskaźnik odtwarza dźwięk i wyświetla komunikat na ekranie dla każdego wygenerowanego sygnału — nie wymaga ręcznego monitorowania.

Kontrola wydajności Konfigurowalny Liczba dni do wyświetlenia (1–60 dni) ogranicza, jak daleko wstecz rysowane są strefy i sygnały, utrzymując niskie zużycie pamięci RAM nawet na ramach czasowych o wysokiej częstotliwości.

Dopasowanie do sesji NY Obsługuje zarówno przesunięcia EST (UTC−5), jak i EDT (UTC−4), zapewniając dokładne granice stref niezależnie od czasu serwera twojego brokera.

Podsumowanie

AI summary
The Quarterly Theory Indicator (ICT) integrates the Inner Circle Trader session cycle framework into cTrader charts by dividing each 24-hour trading day into four color-coded 6-hour zones: Q1 Accumulation (18:00–00:00 NY), Q2 Manipulation (00:00–06:00 NY), Q3 Expansion (06:00–12:00 NY), and Q4 Distribution (12:00–18:00 NY). Each zone is visually distinguished with customizable background colors, opacity, and borders that update dynamically with chart navigation.

The indicator provides four smart entry signals directly on the chart as directional arrows: Q2 Stop-Hunt (detects false breakouts within Q1 highs/lows), Q3 Expansion Entry (signals breakout from Q2 range), Q3 Pullback Entry (identifies retests of breakout levels), and Q4 Distribution (alerts on price crossing back through expansion levels). These signals include real-time alerts with sound and on-screen messages when conditions occur on live bars.

Additional features include a configurable "Days to Show" parameter to limit historical data display for performance optimization and support for both EST and EDT time offsets to align session zones accurately with New York time. The indicator is tagged with market structure concepts such as Fair Value Gap, Break of Structure, and Liquidity Sweep, and outputs visualizations, signals, and filters based on bar data.
Profil wskaźnika
Kategoria wskaźnika
Struktura rynku (SMC)
Typ wyjścia
Wizualizacja
Sygnały
Filtr
Wymagania dotyczące danych
Tylko słupki
Obsługiwane sygnały
Przebicie poziomu
Dotknięcie poziomu
Przełamanie

Opinie klientów

4.0
Opinie: 2
5
0 %
4
100 %
3
0 %
2
0 %
1
0 %
Opinie klientów
September 10, 2026
QuarterlyTheoryStrategy is a clear ICT-style session-cycle indicator that divides the trading day into Q1 Accumulation, Q2 Manipulation, Q3 Expansion and Q4 Distribution zones and adds configurable directional signals. Testing on EURUSD and XAUUSD confirmed the four-zone structure and Q3 Pullback signals in both LONG and SHORT directions. The main reservations were one instance of missing zone backgrounds on EURUSD H1 and label crowding on wider H1 views.
May 27, 2026
Very useful, minor improvements needed Great tool that delivers consistent signals in trending markets. It struggles a bit in choppy or sideways conditions, but that's true for most indicators. Once you understand its strengths and pair it with proper risk management, it becomes a powerful part of your strategy.

Dyskusja

Częste pytania

Fair Value Gap
BOS
Liquidity Sweep
Produkty dostępne za pośrednictwem cTrader Store, w tym boty handlowe, wskaźniki i wtyczki, dostarczane są przez deweloperów zewnętrznych i udostępniane wyłącznie w celach informacyjnych oraz w celu zapewnienia dostępu technicznego. cTrader Store nie jest brokerem i nie zapewnia doradztwa inwestycyjnego, nie udziela spersonalizowanych rekomendacji ani nie gwarantuje przyszłych wyników.

Więcej od tego autora

Wskaźnik
RSI
Forex
+4
High-probability trading signals in the fast-paced world of forex and CFD trading.
Wskaźnik
Prop
Stocks
+4
High-Performance Renko Chart Indicator with Advanced filtering method - built for Renko and candlestick charts.
Wskaźnik
ATR
MSS
+5
Detects ICT Turtle Soup setups — liquidity sweeps with MSS confirmation, ATR filter & kill zone session filter.
Wskaźnik
SMC
Prop
+15
Automatic Elliott Wave Detection with Professional Filters
Wskaźnik
Fibonacci
Key Levels
DailyTargets: Dynamic ADR-based levels & targets. Includes Buy/Sell zones, previous Hi/Lo, and automated trend alerts.
Wskaźnik
EMA
RSI
+2
Advanced TDI indicator with Shark Fin signals, chart arrows, MTF RSI, divergence detection and smart alerts.
Wskaźnik
Key Levels
Order Block
+3
Marks NY session range, detects wick sweeps beyond box edges.. One signal per day. Overlay, no repainting!
Wskaźnik
MACD
Key Levels
+2
Trend indicator with multi-timeframe filters, generating signals only on fully completed bricks & candles. No Repaint.
Wskaźnik
Key Levels
Supertrend
+3
Marks London and New York session opening zones and alerts you instantly on breakouts.
cBot
EMA
SL Manager
+5
Fully automated dual-symbol hedging cBot for cTrader.
20.6%
ROI
8.66
Współczynnik zysku
Logo „KasePeakOscillator”
Najwyżej oceniane
5.0
(4)
Za darmo
Wskaźnik
Volume
Key Levels
KasePeakOscillator: Advanced volatility-adjusted momentum tool with automated peak detection and divergence alerts.
cBot
RSI
Aggressive
automates entries based on the RSX indicator — a smoothed, low-lag variant of the classic RSI.
1.67
Współczynnik zysku

Możesz także polubić

Wskaźnik
MACD
Forex
+5
MACD Indicator with Histogram that plots Colors Based on Direction Above and Below the Zero Line.
Wskaźnik
Allow trader to draw multi trendlines in different timeframes on one chart,Give trader an overview of the current market
Wskaźnik
AI
Prop
+7
EMA Clouds, Multi-Timeframe (MTF) Overlay, Swing High/Low detection, and a smart Dashboard with neutral zone filtering.
Wskaźnik
Risk Dashboard
AI-powered daily range forecasts help traders spot volatility opportunities and plan stops and targets.
Wskaźnik
Prop
Forex
+14
Amplitude Momentum Optimizer — FREE TRIAL Version to Find Out If the Complete Indicator Has a Real Edge.
Wskaźnik
The Multi-Timeframe Candle Indicator displays candles from multiple timeframes in one window, enhancing market analysis!
Wskaźnik
ATR
RSI
+1
Super Trend Rsi ,ATR + trend change distance + dynamic Alpha, divergence/convergence
Wskaźnik
Forex
Fibonacci
+2
Enhance your trading with customizable alerts and dynamic visual tools for trendlines, Fibonacci levels, and more.
Logo „Zigzag Trend”
Najwyżej oceniane
4.5
(4)
$25
/
$45
Wskaźnik
AI
ATR
+23
The ZigZag Trend is a market structure tool that filters out small price fluctuations and highlights major swing.
Wskaźnik
Bollinger
Complete MA-channel system: colored trend, channel boundaries & equilibrium with 6 Fib zones.
Wskaźnik
RSI
Signal
+2
Identifies trends with moving averages & volatility. Base levels = bullish 🐂 or bearish 🐻 signals. Reversals detected!
Wskaźnik
Forex
Crypto
+5
🚀 Automated Elliott Wave & Fibonacci tool for cTrader. Spot trends, corrections & retracements fast.
Wskaźnik
Supertrend
Moving Average
Easy Trade: Trend & Breakout Indicator for cTrader
Wskaźnik
Forex
Identify 34 candlestick patterns, track trends across timeframes, and get instant alerts with this powerful trading tool
Wskaźnik
SMC
Forex
+5
The only cTrader FVG indicator with Breakaway Gap detection, mitigation tracking, and full multi-asset compatibility.
Wskaźnik
Forex
Crypto
+3
Enhance Pitchfork & Price Channels in cTrader with customizable Equidistant and Fibonacci levels.
Wskaźnik
Doji
Volume
+5
Instantly spot high-liquidity institutional moves with clean, non-obtrusive triangle alerts on cTrader charts.
Wskaźnik
ADX
ATR
+5
Range-filter BUY/SELL flips with an ATR or swing stop, three targets, five confluence stars and a live panel

Cena

Od 21/02/2025
466.3M
Wolumen transakcji
180.83K
Zysk w pipsach
26
Sprzedaż
7.43K
Bezpłatne instalacje