
Description
Supply Demand Quadra Zones puts an entry signal, a drawn risk plan and your wider market context on one chart.
WHAT IT DRAWS
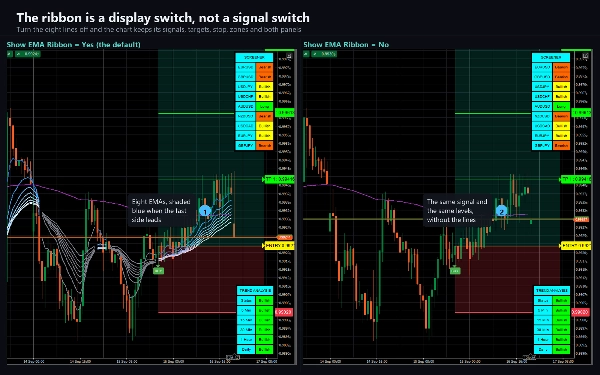
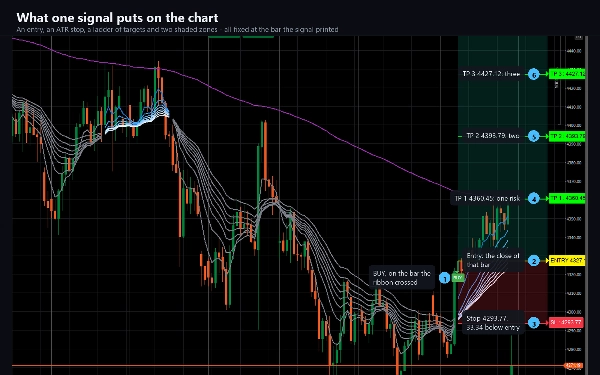
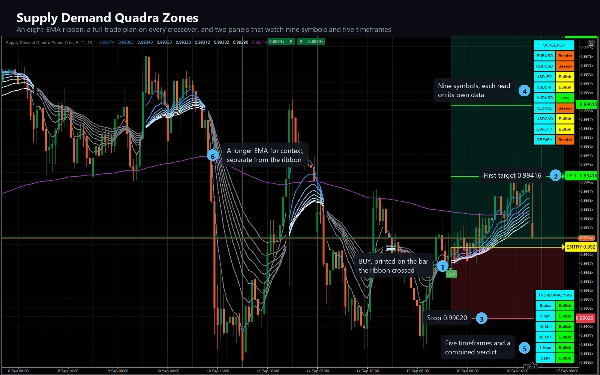
An eight-line EMA ribbon (5, 11, 15, 18, 21, 24, 28, 34) that turns blue while the fast leg leads and grey when it does not, plus a 200-period reference line. When EMA 2 crosses above EMA 8 a BUY plate is drawn; when it crosses back a SELL plate appears.
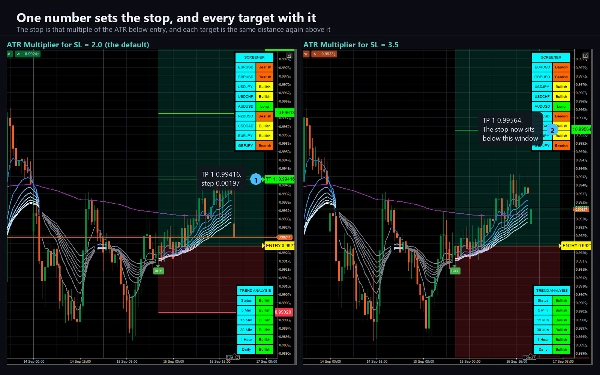
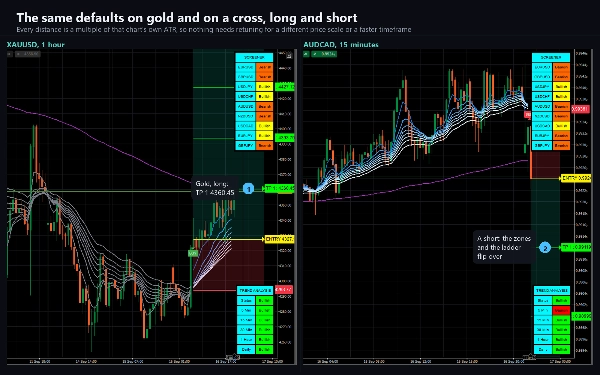
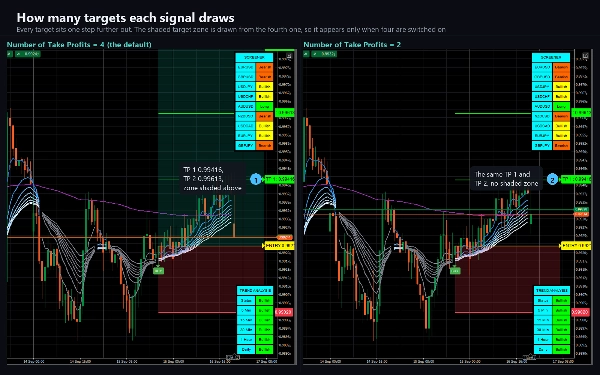
Every signal comes with a complete risk plan already on the chart: an entry line, a stop placed at an ATR multiple, and up to four take-profit levels spaced as multiples of that stop distance. At the default settings the ladder is 1R, 2R, 3R and 4R. Each level carries its own price tag at the right edge, and the space between entry and target and between entry and stop is shaded so the shape of the trade is readable at a glance. The whole plan tracks forward with price and freezes when the trade resolves - either the stop is touched or every enabled target has been reached.
THE TWO PANELS
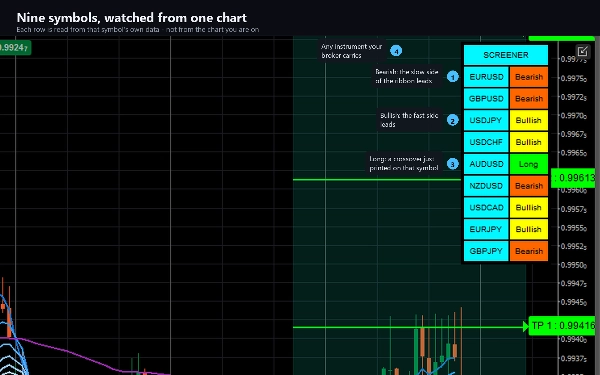
A screener classifies up to nine symbols of your choosing - all read at the chart's own timeframe - as Long, Short, Bullish or Bearish, so you can see which other markets are lining up the same way without opening nine charts.
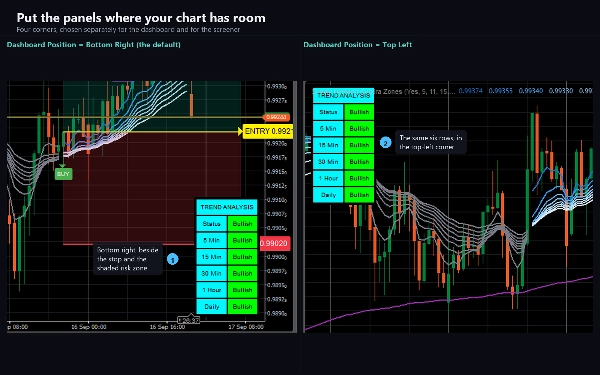
A trend dashboard reports 5-minute, 15-minute, 30-minute, 1-hour and daily direction for the chart symbol, plus a combined Status row decided by a majority vote of three timeframes you pick.
WEBHOOK
Every signal, and every step of the trade that follows it, can be POSTed as JSON to a URL you choose - so an external bot, journal or notification service can act on it without anyone watching the chart. It sends the side, the entry, the stop and the full target ladder, then a message for each target reached, for the stop, and for the trade closing. It is off until you fill in the URL, it never fires while history is loading or during a backtest, and it needs no elevated permissions.
Alerts also deliver through the cTrader log, a sound and e-mail.
REPAINTING, STATED PLAINLY
The BUY and SELL signals do not repaint. They are decided on closed bars and never move once drawn.
The two panels do repaint. Both are drawn on the live bar and read developing higher-timeframe data, so their cells can change until those bars close. Treat them as a live picture of where things stand, not as a record of what happened.
SETTINGS
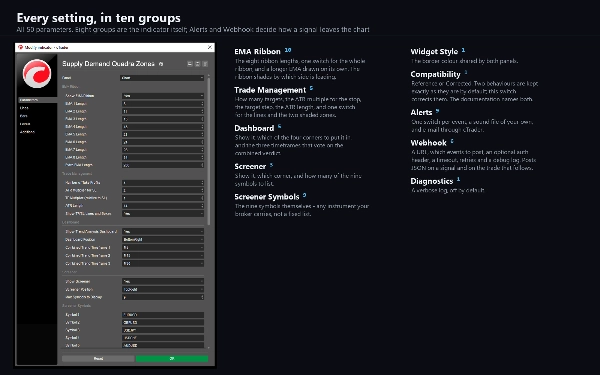
50 parameters. All eight ribbon lengths, the ATR multiplier and target spacing, the number of targets, both panel positions, all nine screener symbols, the three dashboard timeframes, the border colour, the alert channels and the webhook. A Compatibility setting chooses between two behaviours for the 4-hour dashboard option and the shaded target zone - the documentation explains exactly what each does and why the default is what it is.
SUITED TO
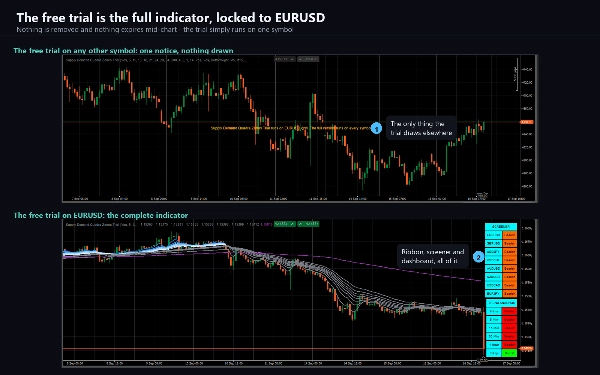
Any instrument and any timeframe the platform offers. The ribbon needs 34 bars before it is fully formed and 200 for the reference line, so very short histories will show fewer lines than a long one.
Trading involves risk. Past performance does not guarantee future results.
Summary
Each trade signal includes a comprehensive risk plan displayed directly on the chart, consisting of an entry line, a stop loss set at a multiple of the Average True Range (ATR), and up to four take-profit levels spaced by multiples of the stop distance. These levels are visually shaded and labeled with price tags for clarity. The risk plan dynamically tracks price movement and freezes upon trade resolution.
The product also includes two panels: a screener monitoring up to nine user-selected symbols on the current timeframe, classifying them as Long, Short, Bullish, or Bearish; and a trend dashboard showing directional trends across five timeframes (5m, 15m, 30m, 1h, daily) with a combined status based on a majority vote of three user-chosen timeframes.
Signals and trade steps can be sent as JSON via webhook to external services for automation or logging. Alerts are available through platform logs, sound, and email. Buy and sell signals are confirmed on closed bars and do not repaint, while the screener and dashboard update live and may change until bar close. The indicator offers extensive customization with 50 parameters covering ribbon settings, ATR multiples, target spacing, panel positions, symbols, alert channels, and webhook configuration.