present
Sign up and get $50 off your first purchase
Trading product for Break Tracer Indicator EMA SMA, image 1
Break Tracer
Indicator
Version 1.0, Sep 2026
Windows, Mac
Trading product for Break Tracer Indicator EMA SMA, image 2
Trading product for Break Tracer Indicator EMA SMA, image 3
Trading product for Break Tracer Indicator EMA SMA, image 4
Trading product for Break Tracer Indicator EMA SMA, image 5
Trading product for Break Tracer Indicator EMA SMA, image 6
Trading product for Break Tracer Indicator EMA SMA, image 7
Trading product for Break Tracer Indicator EMA SMA, image 8
Trading product for Break Tracer Indicator EMA SMA, image 9
Trading product for Break Tracer Indicator EMA SMA, image 10
Trading product for Break Tracer Indicator EMA SMA, image 11
3
Sales
12
Free installs

Description

Break Tracer reads the trend in two layers and only acts when they agree.


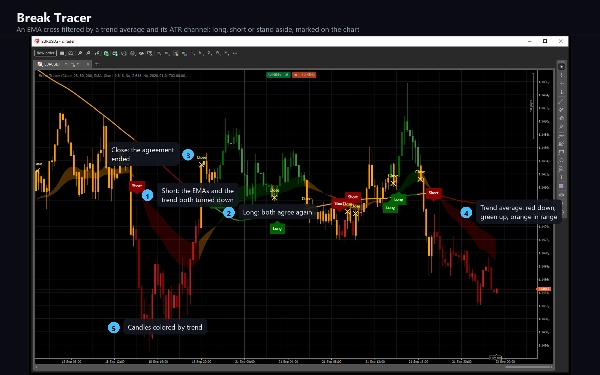
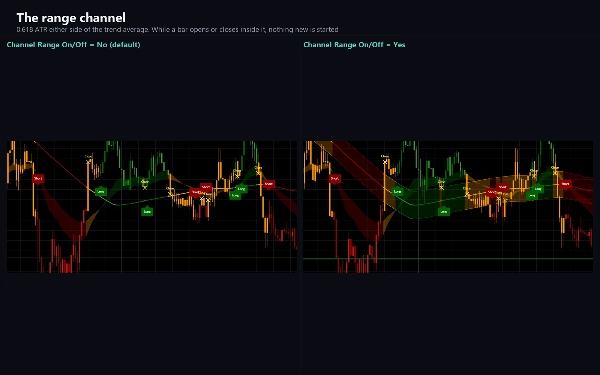
A fast pair of exponential moving averages (26 and 50) gives the short-term direction. A 200-bar trend average, with a channel of 0.618 times the average true range around it, gives the trend. When the fast pair points up and price is above the trend average, the trend is up; when both point down, it is down; and while a bar opens or closes inside the channel, the market is treated as ranging and nothing new is started.


WHAT YOU SEE


A trend line in green or red shades, orange while the market is ranging.

A shaded band between the two fast averages, in the same colours.

A Long plate under the bar where an up-trend begins and a Short plate over the bar where a down-trend begins.

A yellow cross where a position is closed because the trend or the fast averages turned.

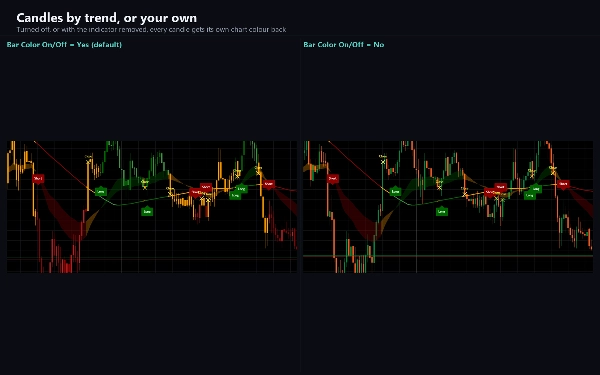
Candles colored by trend, with a lighter shade for a candle that closes against it.

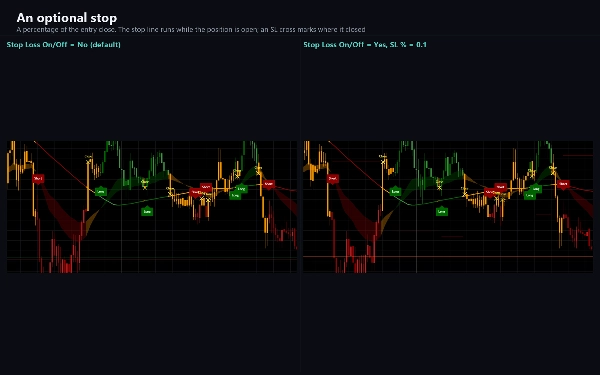
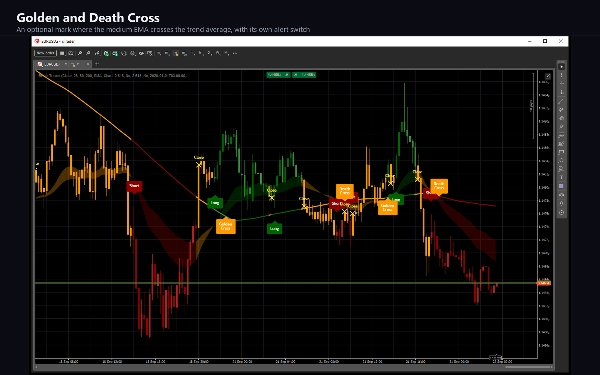
Optional: the channel itself, a stop line with an SL cross at the level that closed the position, Golden Cross and Death Cross plates where the medium average crosses the trend average, and a gray shading outside a date window of your choosing.


HOW TO USE IT


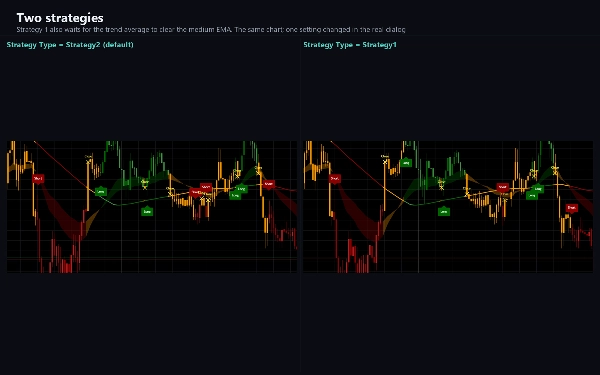
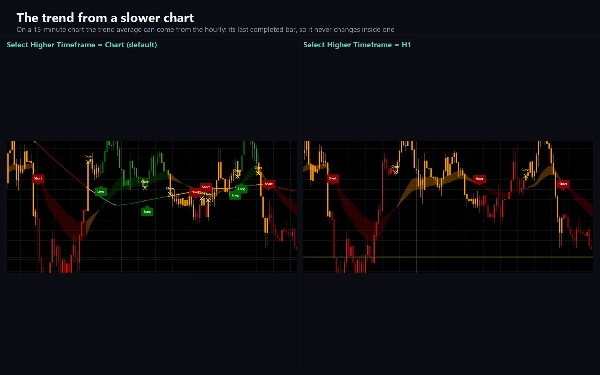
A Long or Short plate marks the moment both layers agree; the close cross marks the moment they stop agreeing. Strategy 2, the default, takes every agreement; Strategy 1 is stricter and stands aside while the trend average is still on the wrong side of the medium average. Long only, short only or both can be chosen. The trend average can be taken from a higher timeframe - for example the hourly on a five-minute chart - and it then uses the last completed higher-timeframe bar, so it never changes within that bar.


SETTINGS


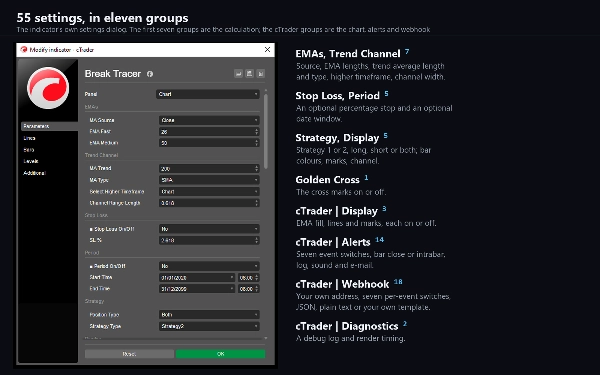
Source, EMA lengths, trend average length and type (SMA or EMA), the higher timeframe, the channel width, an optional percentage stop, an optional date window, the strategy type and which sides to take. Each drawing element has its own switch, and switching one off changes the drawing only: the values, alerts and webhook carry on.


ALERTS AND WEBHOOK


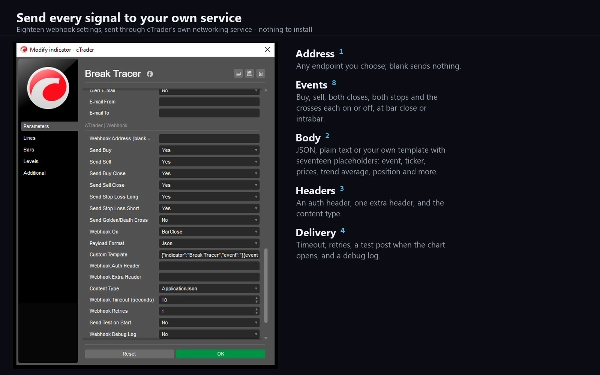
Six events: Buy, Sell, Buy Close, Sell Close, Stop Loss Long and Stop Loss Short, plus Golden and Death Cross as an option. Each has its own switch and can fire when the bar closes or as soon as the condition is met. Delivery is a log line, a sound or an e-mail. There is also a webhook: enter an address and each event is posted to it as JSON, as plain text, or in a template you write yourself with placeholders for the symbol, timeframe, time, prices, the averages, the trend state and the position. It stays off until you enter one, it sends nothing during the history pass or in a backtest, and it needs no special access rights - posts go out through cTrader's own networking service.


FOR cBOTS


The trend average, both fast averages, the trend state and the position state are published as output series.


TYPE AND WINDOW


A trend indicator, drawn on the price chart.


TIMEFRAMES AND INSTRUMENTS


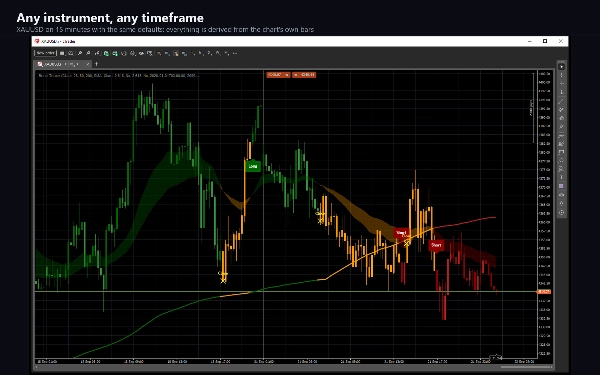
Any time-based timeframe; the defaults read well from M5 to H4, and the higher timeframe option lets a low timeframe chart follow a slower trend. It works on any instrument - forex pairs, metals, indices and crypto - because everything it uses is derived from the bars themselves.


WHO IT IS FOR


Traders who want a trend filter they can see: when to be long, when to be short, when to stand aside, and an alert at each change.


NOTES


The marks follow the bar that is still forming, so one can appear and disappear until that bar closes. Alerts and webhook posts default to bar close, where the condition is final. On a fresh chart the first mark is a Short on the second bar, because nothing can be measured until the averages exist.


Trading involves risk. Past performance does not guarantee future results.

Summary

AI summary
Break Tracer is a trend indicator designed for use on price charts across any time-based timeframe, suitable for instruments including forex pairs, metals, indices, and cryptocurrencies. It combines two layers of trend analysis: a fast pair of exponential moving averages (EMAs) with periods 26 and 50 to capture short-term direction, and a slower 200-bar trend average (SMA or EMA) surrounded by an ATR-based channel (0.618 times the average true range) to define the overall trend. The indicator signals a trend only when both layers agree—uptrend when fast EMAs point up and price is above the trend average, downtrend when both point down, and a ranging market when price bars fall inside the ATR channel.

Visual elements include a color-coded trend line (green/red for trend, orange for range), shaded bands between fast EMAs, Long and Short plates marking trend starts, yellow crosses indicating position closes, and candles colored by trend strength. Optional features include the ATR channel display, stop lines with stop-loss crosses, Golden and Death Cross plates, and customizable date window shading.

Break Tracer supports configurable strategies for trade entries and exits, higher timeframe trend averaging, and selective long/short signals. It provides six alert events (Buy, Sell, Close, Stop Loss, Golden/Death Cross) with customizable delivery via log, sound, email, or webhook posting JSON or templated messages. Output series for cBots include trend averages and position states. Settings allow adjustment of sources, lengths, channel width, stop percentages, and visual elements independently.
Indicator profile
Indicator category
Trend
Output type
Visualisation
Signals
Data requirements
Bars only
Supported signals
Cross
Level break

Customer reviews

0.0
Reviews: 0
Customer reviews
No reviews for this product yet. Already tried it? Be the first to tell others!

Discussion

FAQ

EMA
SMA
Channel
ATR
Moving Average
Products available through cTrader Store, including trading bots, indicators and plugins, are provided by third-party developers and made available for informational and technical access purposes only. cTrader Store is not a broker and does not provide investment advice, personal recommendations or any guarantee of future performance.

More from this author

Indicator
ATR
CCI
+4
A trend line that never steps back, a shaded band to the price, and a pointer at the swing where the trend turns.
Indicator
ATR
RSI
+4
RSI bands drawn on price, confluence-scored BUY/SELL signals, an ATR stop with three targets
Indicator
ATR
RSI
+5
Fusion trend line with a layered cloud, BULL and BEAR labels, scored re-entry triangles and exit markers.
Indicator
ADX
ATR
+5
SuperTrend signals scored on five confluence factors, with an ATR stop, three targets and a dashboard.
Indicator
ADX
ATR
+5
Ten confluence layers scored on every closed bar, with an anti-chop gate, pivot levels and a live dashboard.
Indicator
Volume
Key Levels
+1
Fixed-grid volume profile: bull and bear volume at every price level, with Point of Control and value area.
Indicator
ATR
RSI
+4
Adaptive Ichimoku with nine-factor confluence scoring, five signal types, smart TP/SL and an MTF panel.
Indicator
ATR
EMA
+3
EMA trend, RSI reclaim and divergence signals with ATR stop and two targets, swing levels and a 16-row dashboard.
Indicator
ATR
EMA
+2
Eight-EMA ribbon with ATR trade zones, a nine-symbol screener and a five-timeframe trend dashboard.
Indicator
Key Levels
Order Block
+5
Order blocks, fair value gaps, liquidity sweeps and a 24-timeframe signal scanner on one chart.
Indicator
ADX
ATR
+5
EMA-cross signals scored on six confluence layers, with an ATR stop, three targets and a live panel
Indicator
ADX
ATR
+5
Range-filter BUY/SELL flips with an ATR or swing stop, three targets, five confluence stars and a live panel

You may also like

Indicator
Prop
Forex
+14
🚀See the market’s framework, decide faster. Session-Aware Pivots. Auto Presets. Pro-Grade Zones.🚀
Indicator
AI
SMC
+15
Multi-Timeframe Swing Points Indicator for cTrader that identifies swing highs and lows on both the current timeframe.
Indicator
ATR
Key Levels
+1
See both sides of the trade before you take either one.
Indicator
MultiTF Pivot and SR Indicator
Indicator
EURUSD
GBPUSD
+3
All-in-one suite for ICT concepts: NY Midnight Open, Killzones, automatic Liquidity levels (PDH/L, PWH/L).
Indicator
ATR
Prop
+13
Enhance trading with ATR Bands! Visualize market volatility using dynamic upper and lower ATR bands for precise decision
Indicator
Forex
BTCUSD
+8
Bayesian theory** to forecast a future price while providing **uncertainty ranges** that represent upper and lower bound
Indicator
ATR
BOS
+5
Know how strong each Supertrend flip is: scored BUY/SELL, structure stop + 3 targets, live win-rate dashboard, alerts.
Indicator
Forex
BTCUSD
+7
🚀 TMAX RBA Indicator - The Ultimate Multi-Timeframe Momentum System 🚀
Indicator
XAUUSD
Professional Volume Profile Indicator - Shows volume distribution, POC, Value Areas & Buy/Sell pressure.
Indicator
MSS
Key Levels
+2
Fractal based market structure indicator that identifies HH, HL, LH, and LL pivot with confirmed, non-repainting fractal
Indicator
Signal
UT BOT Rewrited.
Indicator
ADX
ATR
+1
Indicador de Sinais Visuais para Spotcrude (WTI) ou SpotBrent com filtros de tendência, operacional de 10 e 15 minutos.
Indicator
SMC
Forex
+13
MultiFrameCandles para cTrader: La Herramienta Definitiva para Dominar Cualquier Marco de Tiempo
Indicator
Forex
BTCUSD
+11
Auto-detects Bullish/Bearish Engulfing patterns to spot trend reversals. Real-time alerts, custom colors, all symbols.
Indicator
ATR
RSI
+11
This indicator puts three helpful trading tools on your chart at once. Think of it like having three expert traders
Indicator
Volume
Channel
+2
Identify key support and resistance levels through detailed volume distribution analysis.
Indicator
Forex
BTCUSD
+10
🎯Smart Signals : Auto Buy/Sell alerts with dynamic TP/SL algorithm. 💡

Price

3
Sales
12
Free installs