

SwingHighLow
Gösterge
13 satın almalar
Sürüm 1.0, Jul 2025
Windows, Mac
4.3
Değerlendirmeler: 3
Başlangıç 03/01/2025
638.03K
İşlem hacmi
21.34K
Kazanılan pip
19
Satışlar
Açıklama
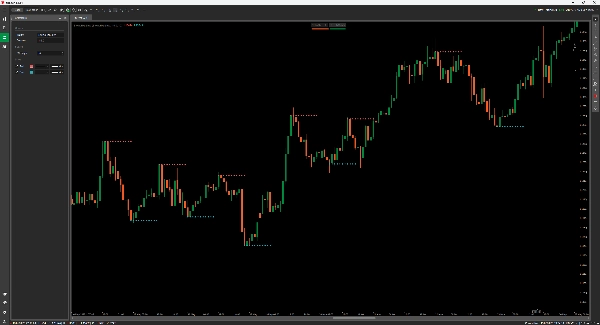
cTrader için Swing High/Low Göstergesi
Piyasa Yapısını Bir Uzman Gibi Haritalayın.
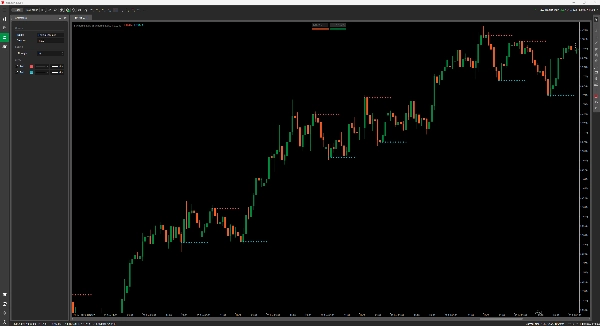
Bu Swing High/Low göstergesi, grafiklerinizde önemli dönüş noktalarını otomatik olarak algılar ve çizer—fiyat hareketine, yapıya ve destek/direnç bölgelerine güvenen traderlar için mükemmeldir.
Özellikler:
- Onaylanmış swing yükseklerini (kırmızı) ve swing düşüklerini (mavi) temiz nokta çizimleriyle vurgular.
- Ayarlanabilir Güç parametresi, gürültüyü filtrelemenize veya sinyalleri sıkılaştırmanıza olanak tanır.
- Trend analizi, dönüş tespiti ve kırılma tuzakları için idealdir.
Tüm zaman dilimlerinde çalışır. Yeniden boyama yapmaz. Sadece net işaretlenmiş sağlam piyasa yapısı.
Özet
AI summary
The SwingHighLow indicator for cTrader automatically detects and plots significant swing highs and lows on price charts, aiding traders in identifying market structure, price reversals, and support/resistance zones. It highlights confirmed swing highs in red and swing lows in blue with clear point markers. The indicator includes an adjustable strength parameter that allows users to filter market noise or tighten signal sensitivity according to their trading preferences. It is suitable for use across all timeframes and supports analysis for various markets including Forex, indices, commodities, stocks, and cryptocurrencies such as BTCUSD, EURUSD, and XAUUSD. The tool is designed to assist with trend analysis, spotting reversals, and identifying breakout traps without repainting, providing consistent and reliable market structure visualization.
Gösterge profili
Müşteri değerlendirmeleri
4.3
Değerlendirmeler: 3
5 | 67 % | |
4 | 0 % | |
3 | 33 % | |
2 | 0 % | |
1 | 0 % |
Müşteri değerlendirmeleri
July 22, 2025
Good support for rules for swing point analysis. it helps identify turning points and cleaner structure, especially when used for reviewing reversals, pullbacks and swing zones. Swing points look better after 3 pivots, especially when the 0.5 Fib area agrees with structure. The level is useful when it supports the market story.
July 21, 2025
July 21, 2025
Practical choice for demo for a more controlled workflow. It helps with reviewing reversals, pullbacks and swing zones, but the signal still needs broader context. Swing points look better after 3 pivots, especially when the 0.5 Fib area agrees with structure. I would still keep manual review in the process.
Tartışma
SSS
BTCUSD
Forex
Signal
Breakout
Indices
EURUSD
Supertrend
Commodities
Stocks
XAUUSD
ATR
cTrader Store üzerinden erişilebilen işlem botları, göstergeler ve eklentiler gibi ürünler, üçüncü taraf sağlayıcılar tarafından sağlanır ve yalnızca bilgilendirme ve teknik erişim amaçlarıyla sunulur. cTrader Store bir broker değildir ve yatırım tavsiyesi, kişisel öneriler vermez veya gelecekteki performansı garanti etmez.
























Fiyat
Başlangıç 03/01/2025
638.03K
İşlem hacmi
21.34K
Kazanılan pip
19
Satışlar