
RSI Advanced
Indikator
1 käufe
Version 1.0, Apr 2026
Windows, Mac
5.0
Bewertungen: 1

Beschreibung
Der standardmäßige Relative Strength Index (RSI) ist einer der beliebtesten Indikatoren weltweit, aber eine einzelne Linie am unteren Rand Ihres Charts zu zeichnen, ist eine veraltete Handelsmethode. Es erschwert das Erkennen echter Momentumwechsel, Beschleunigungen und Marktunruhe.
Der RSI Advanced erfindet diesen klassischen Oszillator komplett neu. Durch die Einführung einer Signallinie, Volatilitätsfilterung und intelligenter Chartdarstellung verwandelt er den RSI in ein umfassendes, alles-in-einem Momentum- und Trendfolge-Dashboard.
Hauptmerkmale
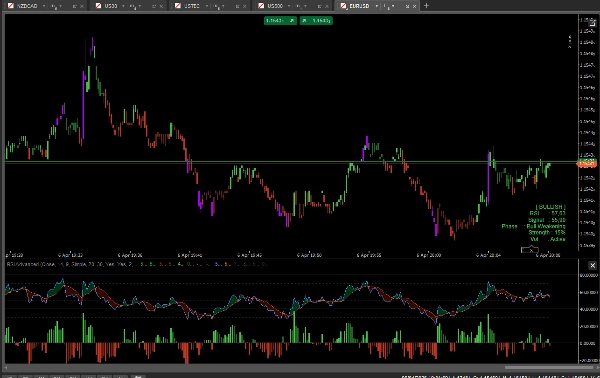
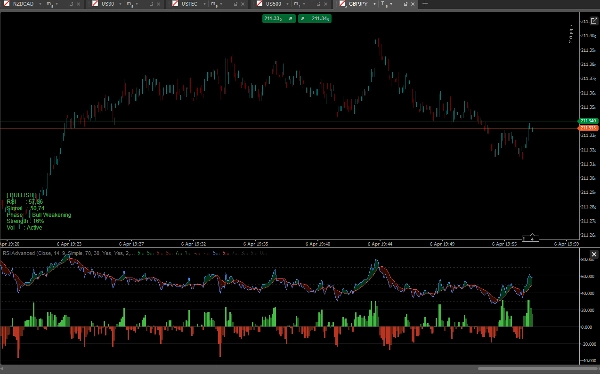
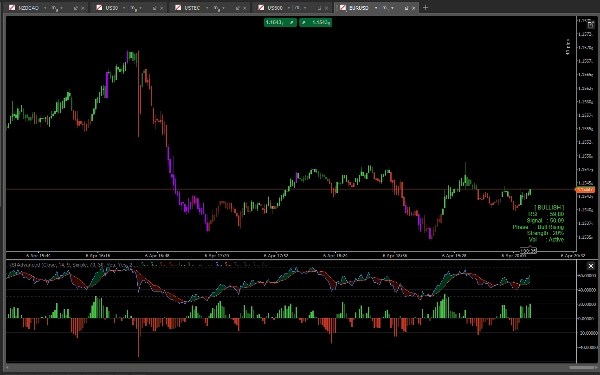
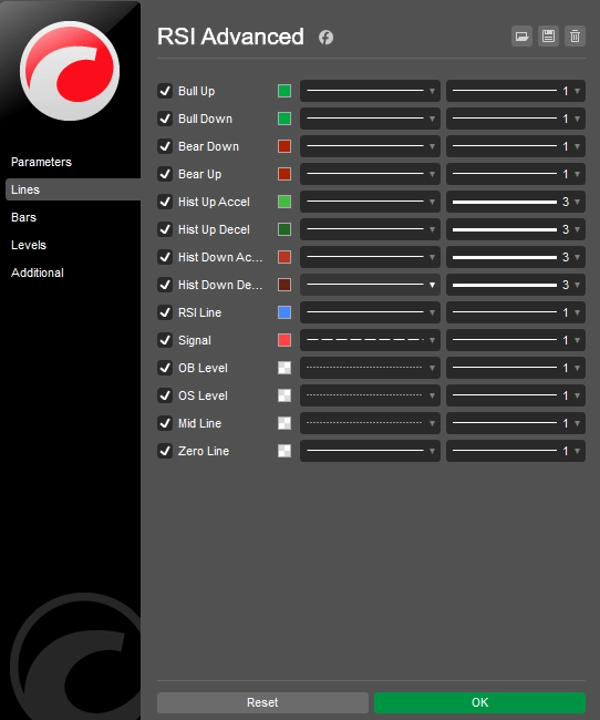
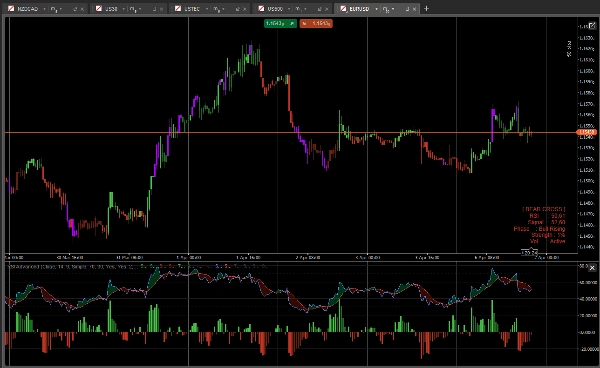
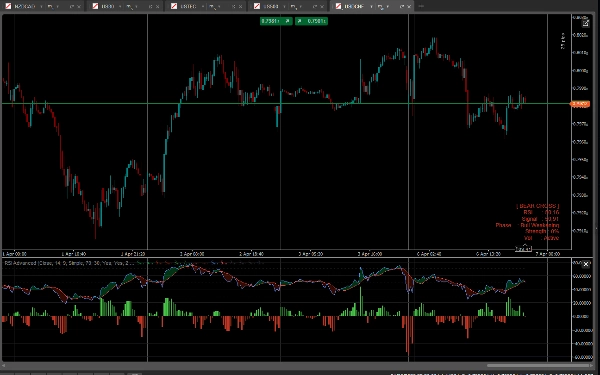
- RSI & Signal-Cloud: Wir haben dem RSI einen gleitenden Durchschnitt (Signallinie) hinzugefügt. Der Raum zwischen dem RSI und seiner Signallinie wird mit einer dynamischen Cloud gefüllt. Ist die Cloud grün, treiben die Bullen das Momentum an. Ist sie rot, haben die Bären die Kontrolle.
- Momentum-Histogramm: Ein zentriertes Histogramm verfolgt den genauen Abstand zwischen RSI und Signallinie. Mit integrierten Beschleunigungs-/Verzögerungsfarben (hell vs. dunkel) können Sie Kreuzungen und Momentumerschöpfung antizipieren, bevor sie eintreten.
- Intelligente Balkenfärbung (Paintbars): Ihre Kerzen ändern ihre Farbe basierend auf dem zugrunde liegenden RSI-Momentum:
-
- Hellgrün/Rot: Starke bullische/bärische Ausrichtung (RSI > 50 und RSI > Signal).
- Dunkelgrün/Rot: Schwaches Momentum oder Rücksetzer.
- Lila/Magenta: Extreme Überkauft- (OB) oder Überverkauft-Level (OS) – warnt vor möglichen Umkehrungen.
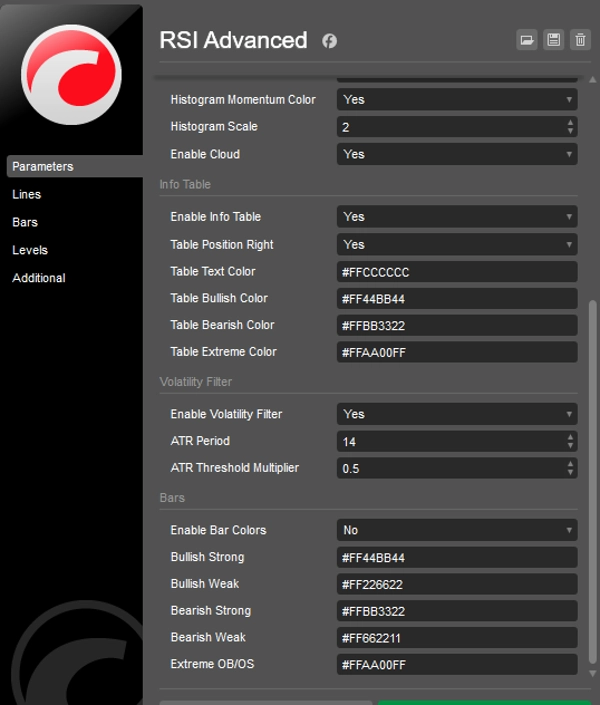
- Intelligenter Volatilitätsfilter (ATR): Müde davon, in Seitwärtsmärkten zerschnitten zu werden? Aktivieren Sie den integrierten ATR-Filter. Wenn die Volatilität unter Ihren historischen Durchschnitt fällt, werden die Kerzen und das Histogramm grau, um Sie vor schlechten Trades zu schützen.
- On-Chart Info-Dashboard: Ein elegantes Datenpanel zeigt Echtzeitmetriken: genaue RSI- und Signalwerte, Momentumphase, Trendstärke in Prozent und Volatilitätsstatus.
- Vollständig freigeschaltet: Handeln Sie mit JEDEM Symbol (Forex, Krypto, Indizes, Aktien) und JEDEM Zeitrahmen ohne Einschränkungen. Lebenslanger Zugang.
Wie handelt man damit?
- Trendfortsetzung: Suchen Sie nach Rücksetzern, bei denen der RSI über der 50-Mittellinie bleibt, aber leicht in die Signallinie eintaucht. Wenn das Histogramm beschleunigt (hellgrün) und die Kerzen hellgrün werden, ist das ein starkes Einstiegssignal für die Fortsetzung.
- Umkehrungen: Wenn die Kerzen lila werden (extrem OB/OS), warten Sie darauf, dass der RSI wieder über die Signallinie kreuzt (Cloud ändert die Farbe) für ein hochwahrscheinliches Umkehr-Setup.
- Vermeidung von Seitwärtsbewegungen: Wenn der Volatilitätsfilter Ihre Balken grau färbt, legen Sie einfach die Hände in den Schoß und warten Sie, bis der Markt wieder Fahrt aufnimmt.
Zusammenfassung
Indikatorprofil
Indikatorkategorie
Volatilität
Ausgabetyp
Filter
Datenanforderungen
Nur Balken
Unterstützte Signale
Durchbrechen
Trendstärke
Volatilität
Kundenbewertungen
5.0
Bewertungen: 1
5 | 100 % | |
4 | 0 % | |
3 | 0 % | |
2 | 0 % | |
1 | 0 % |
Kundenbewertungen
April 11, 2026
The first thing that worked was timing feels less random, and a small account test feels safer.
Diskussion
Häufig gestellte Fragen (FAQ)
BTCUSD
Forex
Signal
Indices
EURUSD
Commodities
GBPUSD
NZDUSD
RSI
AI
XAUUSD
NAS100
ATR
USDJPY
Über den cTrader Store verfügbare Produkte, einschließlich Handelsbots, Indikatoren und Plugins, werden von externen Entwicklern bereitgestellt und nur zu Informations- und technischen Zugriffszwecken verfügbar gemacht. cTrader Store ist kein Broker und erbringt keine Anlageberatung, persönlichen Empfehlungen oder eine Garantie für zukünftige Performance.


![„[Stellar Strategies] MARSI Signal Plotter“-Logo](https://cdn.ctrader.com/image/webp/7b2b8da6-8f8e-4646-8d4a-4710c516c01e_25567)


Preis
24
Verkäufe
662
Kostenlose Installationen