
HLC_Levels
Indikator
4 käufe
Version 1.0, Feb 2026
Windows, Mac
4.3
Bewertungen: 3
Beschreibung
Beschreibung:
Hören Sie auf, jeden Tag manuell Linien zu zeichnen. Erweiterte HLC- & Sitzungsniveaus ist ein umfassender Indikator, der für professionelle Trader entwickelt wurde, die sich auf institutionelle Bezugspunkte verlassen. Egal, ob Sie Price Action, ICT-Konzepte oder Breakout-Strategien handeln, dieses Tool hält Ihr Chart sauber und Ihre Niveaus präzise.
Hauptmerkmale:
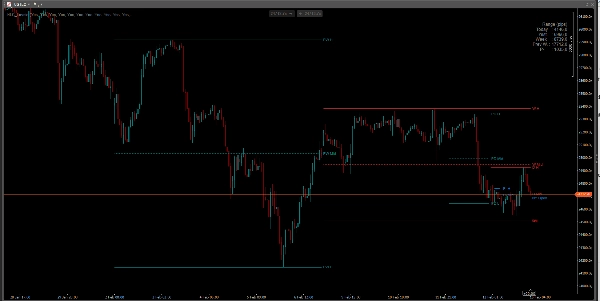
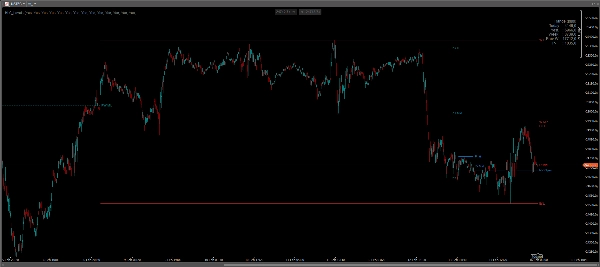
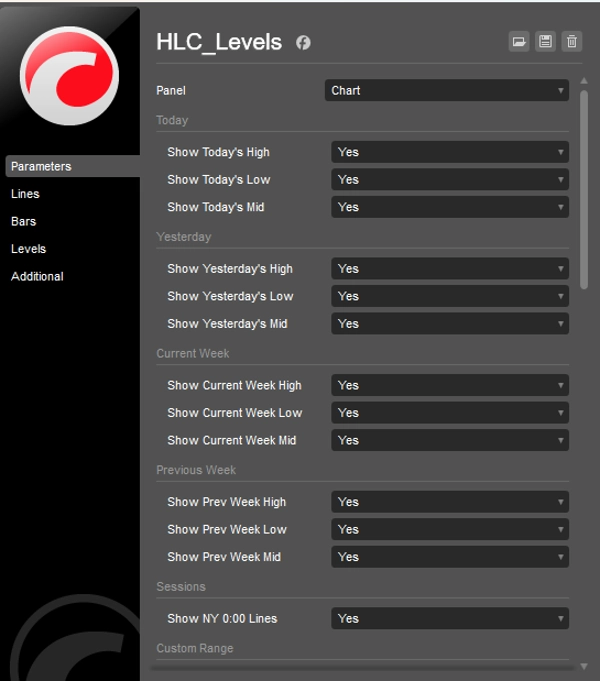
- Tägliche Niveaus: Zeigt automatisch das Hoch, Tief und Mittel (50%) von Heute und Gestern an.
- Wöchentliche Niveaus: Visualisiert das Hoch, Tief und Mittel der aktuellen und vorherigen Woche.
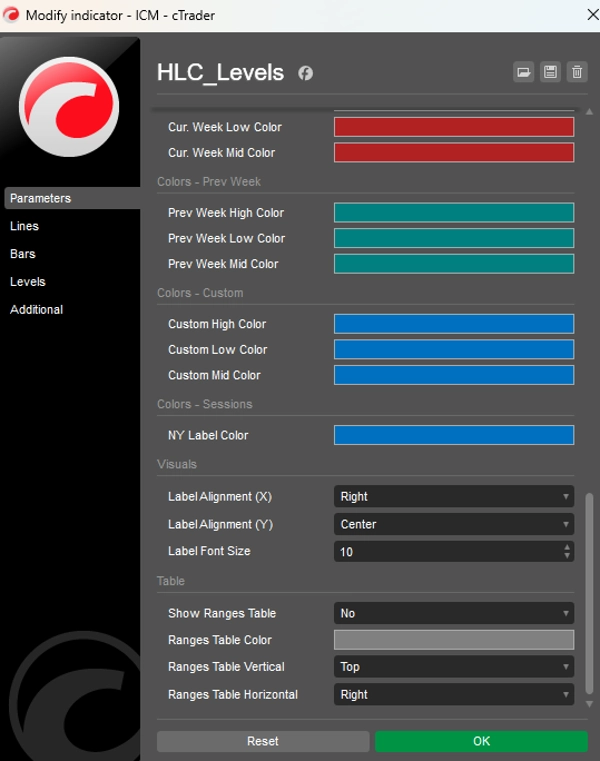
- NY Mitternachtsöffnung: Ein spezieller Schalter für das institutionelle New Yorker 00:00 Preisniveau (True Day Open), entscheidend für die Richtungsbestimmung.
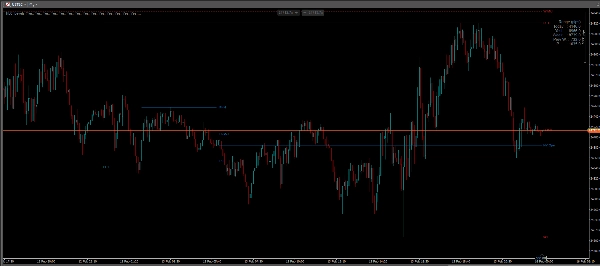
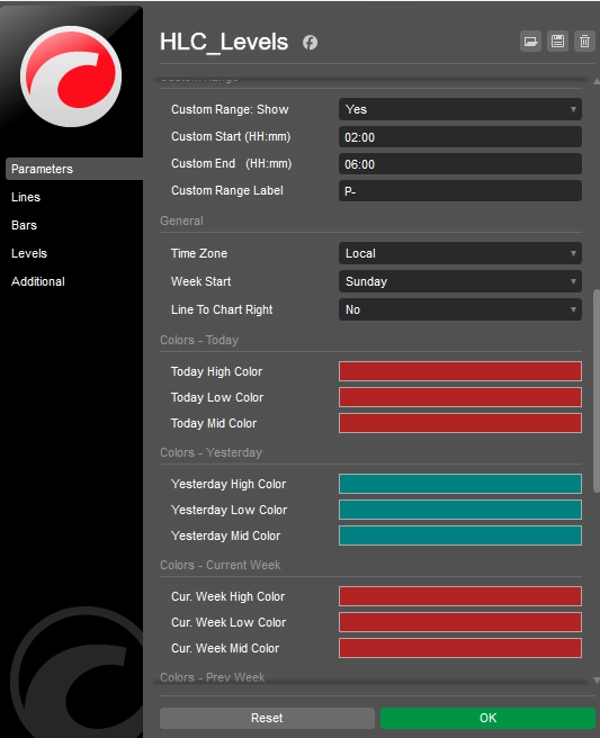
- Benutzerdefinierter Bereich / Sitzung: Definieren Sie Ihr eigenes Zeitfenster (z.B. Asien-Sitzung, Londoner Eröffnung oder Initial Balance). Der Indikator zeichnet das Hoch, Tief und Mittel für diesen spezifischen Zeitraum.
- Volatilitäts-Dashboard: Eine Tabelle im Chart, die die Pip-Spanne (Hoch minus Tief) für Tag, Gestern, Woche, Vorwoche und Ihren benutzerdefinierten Bereich anzeigt.
- Zeitzonen-Intelligenz: Funktioniert mit Broker-Zeit, UTC, NY oder Ortszeit, um sicherzustellen, dass die Niveaus mit Ihrer Strategie übereinstimmen.
Warum diesen Indikator verwenden?
- Reaktionspunkte: Alte Hochs/Tiefs und Mittelpunkte fungieren oft als starke Unterstützungs- und Widerstandszonen.
- Mittelwert (Gleichgewicht): Das 50%-Niveau ist entscheidend, um "Discount"- gegenüber "Premium"-Preisen zu identifizieren.
- Vollständig anpassbar: Schalten Sie jede Linie ein/aus. Ändern Sie Farben, Linienstile und Beschriftungspositionen, um Ihre Vorlage anzupassen.
Einstellungen:
- Aktivieren/Deaktivieren Sie bestimmte Zeitrahmen (Heute, Gestern, Woche, Vorwoche).
- Benutzerdefinierte Start-/Endzeiten für bestimmte Sitzungsbereiche.
- Option "Linien verlängern", um Niveaus in die Zukunft zu projizieren.
- Benutzerdefinierte Farben für jede Gruppe von Linien.
Zusammenfassung
Indikatorprofil
Kundenbewertungen
4.3
Bewertungen: 3
5 | 33 % | |
4 | 67 % | |
3 | 0 % | |
2 | 0 % | |
1 | 0 % |
Kundenbewertungen
May 16, 2026
Bit weird to see there is no Close level eventhough it's called HLC_levels.. There is a high and low and a mid, but no close. I kinda find it essential to have a close though. Other than that is safes me huge amount of time daily to not set all these levels manually. So besides the lack of the close level i still like this indicator. Would love to see a new version with the added close level as the name suggests
March 2, 2026
A 5 minute check should not become a 30 minute rabbit hole, and the entry needs one more reason to make sense.
February 21, 2026
most of the value comes from the decision gets a little more breathing room. The market context still matters.
Diskussion
Häufig gestellte Fragen (FAQ)
Prop
Forex
Scalping
Indices
SMC
AI
XAUUSD
NAS100
USDJPY
Über den cTrader Store verfügbare Produkte, einschließlich Handelsbots, Indikatoren und Plugins, werden von externen Entwicklern bereitgestellt und nur zu Informations- und technischen Zugriffszwecken verfügbar gemacht. cTrader Store ist kein Broker und erbringt keine Anlageberatung, persönlichen Empfehlungen oder eine Garantie für zukünftige Performance.


Preis
24
Verkäufe
662
Kostenlose Installationen