
Beschreibung
MACD Custom MTF (Multiple Time Frame) v1.1 ist ein fortschrittliches Tool, das die bewährte Kraft des klassischen MACD mit dem entscheidenden Vorteil der Multi-Timeframe-Analyse und moderner, intuitiver Visualisierung verbindet. Entwickelt für anspruchsvolle Trader, die Präzision, schnelle Interpretation und die Möglichkeit verlangen, Werkzeuge an ihre einzigartige Strategie anzupassen.
Neu in Version 1.1:
- 100% Glatte Visuals: Behobene unterbrochene/disjunkte MACD-Linien – die Linien sind jetzt während Trendwechseln perfekt durchgehend.
- Bessere Sichtbarkeit: Vergrößerte Punkte für Kauf-/Verkaufssignale, verdickte Signallinie und Histogramm für eine kristallklare Ansicht. Die Nulllinie wurde abgedunkelt, um die Augenbelastung zu reduzieren.
- Intelligente & Vereinfachte Alarme: Das Einstellungsfenster wurde aufgeräumt. Einfach "Kaufalarm" oder "Verkaufsalarm" umschalten und der Indikator übernimmt automatisch die Popups auf dem Bildschirm und die korrekten Sound-Benachrichtigungen.
- Organisierte Einstellungen: Alle Parameter sind jetzt schön in intuitive Kategorien gruppiert für eine deutlich bessere Benutzererfahrung.
- Vollständige englische Lokalisierung: Alle Protokollnachrichten, Popups und Fehler wurden vollständig ins Englische lokalisiert.
Multi-Timeframe (MTF) Analyse auf einem einzigen Chart:
Beenden Sie das Chart-Hin- und Herwechseln! Zeigen Sie MACD-Daten aus einem höheren Zeitrahmen (z. B. H1, H4, D1) direkt auf Ihrem aktuellen Arbeitschart (z. B. M5, M15) an. Gewinnen Sie unschätzbaren breiteren Marktkontext, identifizieren Sie dominante zugrundeliegende Trends und filtern Sie effektiv irreführendes Rauschen aus niedrigeren Zeitrahmen heraus. Voll konfigurierbar – wählen Sie aus einer umfassenden Liste von Zeitrahmen, von Minuten bis monatlich.
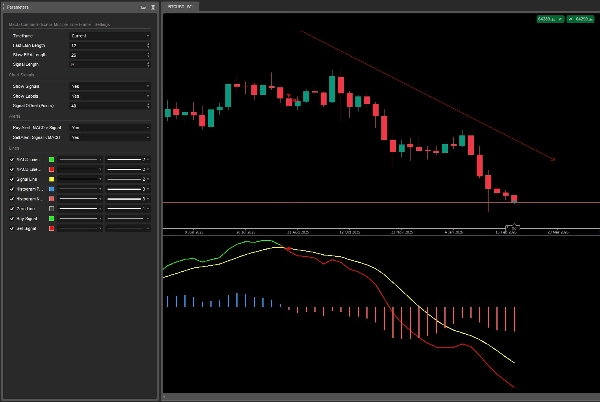
Dynamische MACD- & Signallinienfärbung:
Sofortige Trendbestätigung: Die MACD-Linie ändert dynamisch die Farbe beim Kreuzen ihrer Signallinie und veranschaulicht lebhaft bullische oder bärische Dynamik. Kein Rätselraten mehr – die Linienfarbe zeigt sofort an, ob der MACD über (bullisch) oder unter (bärisch) seiner Signallinie liegt.
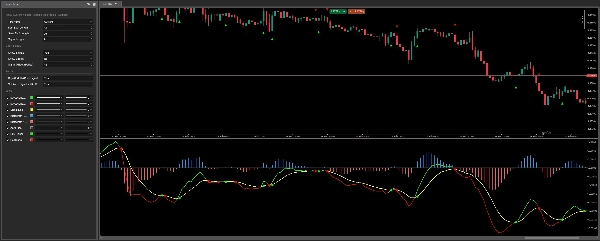
Kristallklares Histogramm:
Visualisieren Sie einfach die Divergenz (Stärke) zwischen dem MACD und seiner Signallinie. Der Indikator färbt verdickte Balken intuitiv basierend darauf, ob sie positiv (blau) oder negativ (rot) sind, und bietet so tiefgehende Einblicke in Momentumverschiebungen auf einen Blick.
Unverwechselbare visuelle Kreuzungssignale:
Verpassen Sie nie wieder eine kritische Kreuzung! Der Indikator hebt MACD/Signallinien-Kreuzungen automatisch hervor. Er zeichnet deutlich sichtbare Punkte direkt auf Ihrem Preischart (mit einstellbarem Versatz) und bietet optionale "Kauf"/"Verkauf"-Textlabels für maximale Klarheit.
Integrierte intelligente Alarme:
Verfügt über eingebaute, unkomplizierte Popup- und Sound-Benachrichtigungen für Kauf- und Verkaufssignale. Bleiben Sie über jede Gelegenheit informiert, ohne an den Bildschirm gefesselt zu sein! Schalten Sie die Alarme einfach in den Einstellungen ein und lassen Sie den Indikator für Sie beobachten.
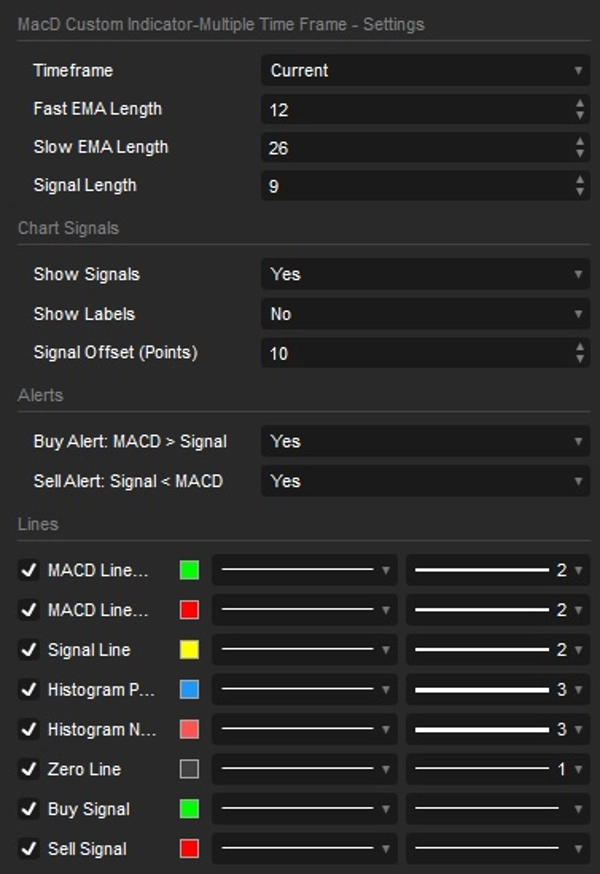
Volle Anpassungsmöglichkeiten an Ihren Fingerspitzen:
- Passen Sie die Längen von Fast EMA, Slow EMA und Signallinie genau nach Ihren Vorgaben an.
- Alle Einstellungen sind übersichtlich in logische Gruppen (MACD-Einstellungen, Chart-Signale, Alarme) für schnelle Anpassungen organisiert.
- Schalten Sie die Sichtbarkeit einzelner visueller Elemente um: MACD- & Signallinien, Histogramm, Kreuzungssignale und Labels.
- Einstellbarer Signalversatz, um perfekt zu Ihrer Chart-Ästhetik und Ihren Vorlieben zu passen.
Zusammenfassung
Key features include dynamic coloring of the MACD and signal lines to indicate bullish or bearish momentum, a crystal-clear histogram that visualizes the divergence between MACD and its signal line with color-coded bars, and unmistakable visual crossover signals marked by distinct dots or arrows on the price chart. The indicator supports integrated alerts with popup and sound notifications for buy and sell signals, configurable via a streamlined settings interface.
Users can fully customize the indicator by adjusting Fast EMA, Slow EMA, and Signal Line lengths, toggling visibility of visual elements (lines, histogram, signals, labels), and modifying colors and line thickness. The settings are organized into intuitive categories for ease of use. This indicator supports a wide range of timeframes from minutes to monthly and is suitable for various markets including Forex, indices, commodities, stocks, and cryptocurrencies.
Kundenbewertungen
5 | 100 % | |
4 | 0 % | |
3 | 0 % | |
2 | 0 % | |
1 | 0 % |


