
Beschreibung
Market Cipher A ist ein fortschrittlicher technischer Indikator, der für eine einfache Analyse, Identifikation und Vorhersage von Makrotrends im Kryptowährungsmarkt entwickelt wurde.
Struktur und Komponenten
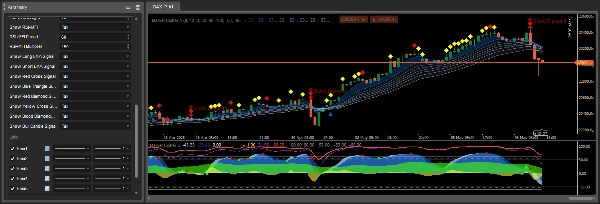
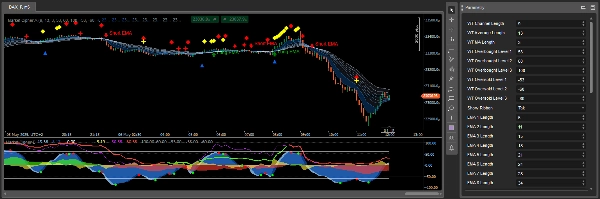
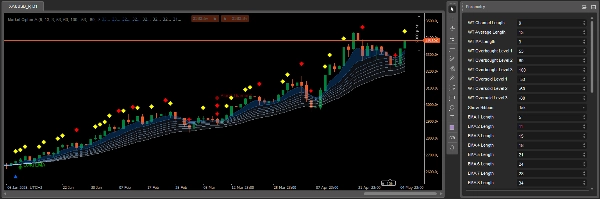
Market Cipher A besteht aus einem Band von 8 exponentiellen gleitenden Durchschnitten (EMA), die je nach Markttrend die Farbe wechseln. Das EMA-Band wird während eines Bullenmarktes blau oder weiß und während eines Bärenmarktes grau.
Standardmäßig werden gleitende Durchschnitte mit EMA-Werten von 5 bis 34 verwendet. Kreuzungen dieser Linien können sehr starke nachlaufende Indikatoren sein, weshalb Market Cipher A so programmiert wurde, dass automatisch Symbole angezeigt werden, die verschiedenen Signalen entsprechen, wodurch die manuelle Interpretation jeder bullischen oder bärischen Kreuzung entfällt.
Symbole und Handelssignale
Market Cipher A zeigt charakteristische Symbole direkt im Kerzenchart an, die potenzielle Handelsmöglichkeiten anzeigen:
Blaues Dreieck - Trendwendesignal, zeigt nachlassende Dynamik und eine bevorstehende Umkehr an. Es ist eine Frühwarnung, dass die Dynamik des Trends abnimmt.
Grüner Kreis - bullisches Signal, am zuverlässigsten auf 6-Stunden-Zeitrahmen und höher. Erscheint typischerweise nach einem blauen Dreieck und sollte innerhalb von 1-3 Kerzen interpretiert werden.
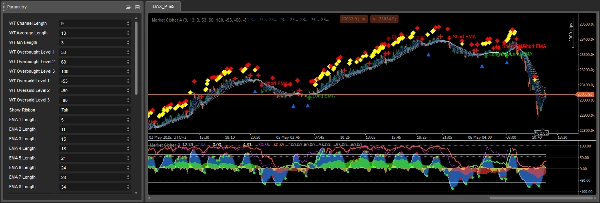
Gelbe Diamanten - zeigen die Fortsetzung eines Aufwärtstrends an. Sollten zusammen mit dem EMA-Band verwendet werden, um die Trendrichtung besser zu bestätigen.
Rote Diamanten - signalisieren eine Abschwächung des Trends und eine mögliche Abwärtsfortsetzung. Zeigen eine erhöhte Abwärtsdynamik an.
Rotes X - bärisches Signal, am effektivsten auf 1-Stunden-Zeitrahmen und höher. Sollte zusammen mit dem EMA-Band und dem roten Diamanten verwendet werden.
Gelbes X - zeigt Marktmanipulation an, insbesondere das schnelle Aufkaufen und Verkaufen großer Long-Positionen durch Short-Positionen.
Großer roter Diamant (Blood Diamond) - das bärischste Signal, das eine hohe Wahrscheinlichkeit für einen Rückgang anzeigt, besonders wenn es zusammen mit einem roten X oder kleineren roten Diamanten auftritt.
Anwendungsprinzipien
Market Cipher A bietet starke mathematische Unterstützung oder Widerstand visuell, was ein einfaches Verständnis des Handelsumfelds ermöglicht. Es funktioniert am besten mit Heiken Ashi-Kerzen.
Das EMA-Band zeigt nicht nur den Trend an, sondern fungiert auch als dynamische Unterstützungs- und Widerstandsniveaus. Wenn das Band blau/weiß ist und die Kerzen darüber liegen, können Sie nach Gelegenheiten für Long-Positionen suchen. Wenn das Band grau ist und die Kerzen darunter liegen, können Sie Short-Positionen in Betracht ziehen.
Beste Ergebnisse werden erzielt, wenn Signale von Market Cipher A mit anderen Indikatoren aus dem Market Cipher-Paket kombiniert werden, insbesondere Market Cipher B, der zusätzliche Momentum-Signale und Einstiegspunkte liefert.
Detaillierte Signalinterpretation im Trendkontext
Ein wichtiger Aspekt von Market Cipher A ist die kontextbezogene Signalinterpretation abhängig vom dominanten Trend. Wenn das Band die Farbe von Grau zu Blau wechselt, erzeugt der Indikator einen grünen Kreis als Signal für den Beginn eines Aufwärtstrends. Normalerweise ist die Wahrscheinlichkeit eines Ausbruchs hoch, wenn nach einem grünen Kreis in den nächsten 1-3 Kerzen ein gelber Diamant erscheint. Wenn jedoch rote Diamanten auftauchen, ist ein Ausbruch weniger wahrscheinlich.
Während eines Bullenmarktes sind gelbe Diamanten günstig und zeigen eine Aufwärtsfortsetzung im Einklang mit dem Trend, während rote Diamanten eine gegenläufige Bewegung darstellen. In einem Bärenmarkt ist die Situation umgekehrt – rote Diamanten sind günstig als Fortsetzung des Rückgangs, und gelbe Diamanten zeigen eine vorübergehende Aufwärtsbewegung entgegen dem Trend an.
Das rote X ist am zuverlässigsten, wenn es nach einem roten Diamanten erscheint und das EMA-Band fast vollständig verengt ist und die Farbe zu bärischem Grau wechselt. Die Genauigkeit dieses Indikators variiert je nach Zeitrahmen.
Funktionsmechanismus und Signalgenerierung
Die Symbole und Signale in Market Cipher A werden basierend auf mehreren Quellen generiert: WaveTrend-Wellenkreuzungen, überkaufte und überverkaufte Niveaus sowie basierend auf RSI und MFI, wenn diese die Mittellinie kreuzen oder überkaufte und überverkaufte Zustände erreichen. Diese multidimensionale Analyse macht die Signale umfassender als einzelne Indikatoren.
Das EMA-Band besteht aus 8 gleitenden Durchschnitten, die ein charakteristisches Band mit Abständen zwischen den einzelnen Bändern bilden. Die Bandbreite ist ein wichtiger Faktor – breite Abstände deuten auf einen starken Trend hin, während verengte Bänder eine nachlassende Dynamik oder Konsolidierung vermuten lassen.
Praktische Anwendung in Handelsstrategien
Market Cipher A wurde hauptsächlich als Werkzeug zur Trendanalyse entwickelt und funktioniert daher am besten in trendfolgenden Strategien. Es wird empfohlen, das Band zusammen mit anderen Trendidentifikationsindikatoren zu verwenden und dann nach Handelsmöglichkeiten während Kursrücksetzern zu suchen.
Es ist wichtig zu beachten, dass diese Signale helfen, den Zeitpunkt für Ein- oder Ausstiege zu verfeinern, aber nicht allein zur Entscheidungsfindung im Handel verwendet werden sollten. Zusätzliche Bestätigungen sind erforderlich, insbesondere für Umkehrsignale, die während seitwärts gerichteter Kursbewegungen auftreten.
Zusammenfassung
The indicator automatically displays distinct symbols on the price chart to signal potential trading opportunities:
- Blue Triangle: signals declining momentum and possible trend reversal.
- Green Circle: indicates a bullish trend start, most reliable on 6-hour timeframes and above.
- Yellow Diamonds: suggest continuation of an upward trend.
- Red Diamonds: indicate trend weakening and potential downward continuation.
- Red X: bearish signal effective on 1-hour timeframes and higher.
- Yellow X: points to market manipulation events.
- Large Red Diamond ("Blood Diamond"): strong bearish signal with high probability of decline.
Signals are generated using a combination of WaveTrend crossovers, RSI, and MFI indicators, providing multidimensional market analysis. Market Cipher A is optimized for use with Heiken Ashi candles and is best applied within trend-following strategies, ideally combined with other Market Cipher indicators for enhanced entry and momentum confirmation.
Kundenbewertungen
5 | 67 % | |
4 | 33 % | |
3 | 0 % | |
2 | 0 % | |
1 | 0 % |


![„[Hamster-Coder] Pivot Points MTF“-Logo](https://cdn.ctrader.com/image/webp/4c143e5a-309c-40e3-a578-f04d1e133ffa_31159)


