present
Registrieren Sie sich und erhalten Sie $50 Rabatt auf Ihren ersten Kauf
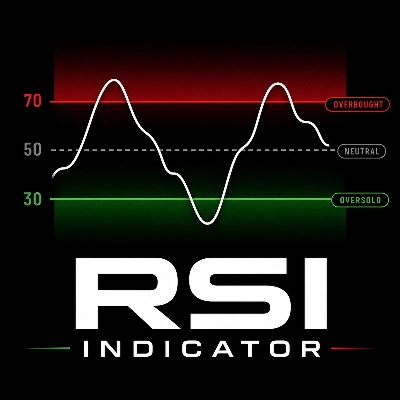
Trading product for RSI Indicator Indikator SMA RSI, image 1
RSI Indicator
Indikator
Version 1.0, May 2026
Windows, Mac
Trading product for RSI Indicator Indikator SMA RSI, image 2
Trading product for RSI Indicator Indikator SMA RSI, image 3
95
Verkäufe
171
Kostenlose Installationen

Beschreibung

Showcase:


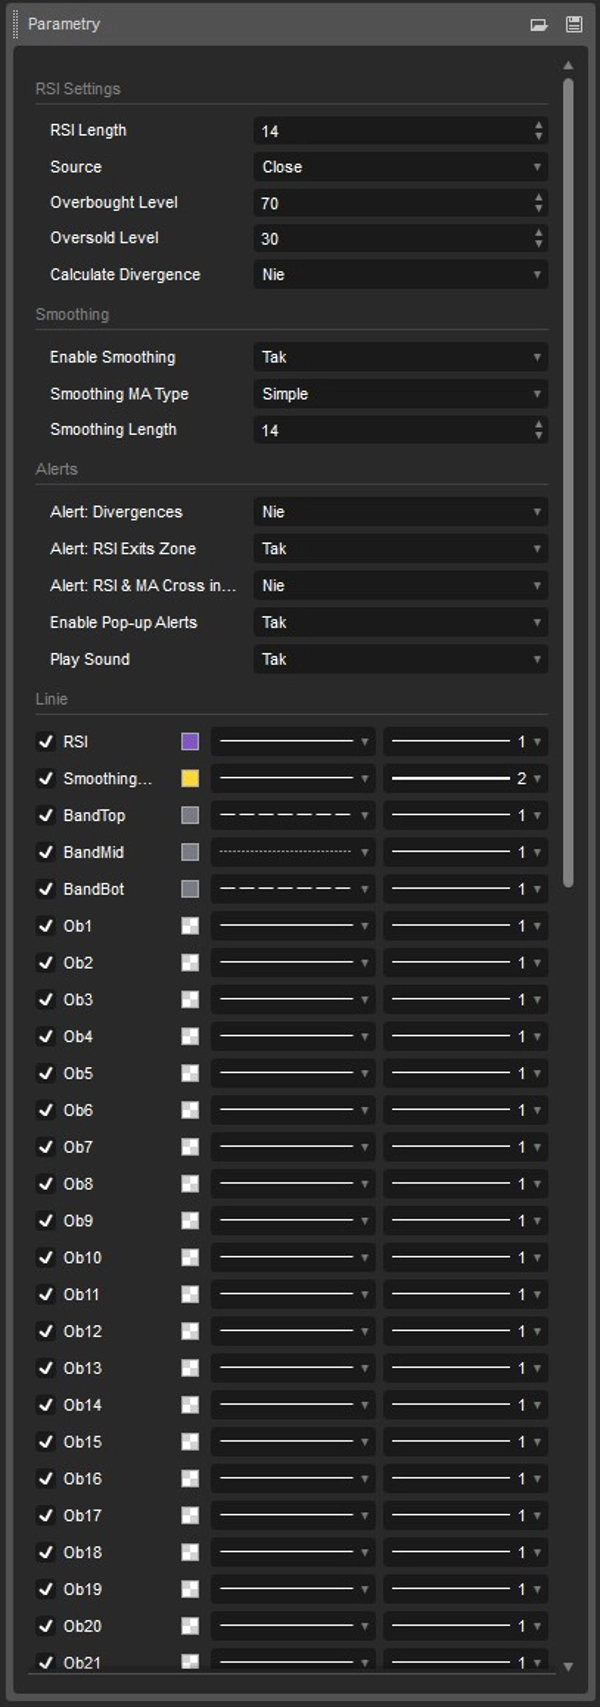
RSI Indicator - dieser Indikator ist eine fortschrittliche, aber dennoch saubere Umsetzung des klassischen Relative Strength Index (RSI) Oszillators für die cTrader-Plattform. Er wurde in strikter Übereinstimmung mit dem Originalindikator von TradingView entwickelt (basierend auf deren offizieller Spezifikation).

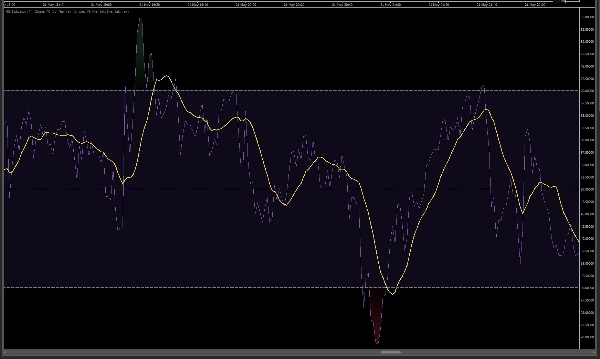
Dank der Verwendung des RMA (Running Moving Average) Glättungsmodells verhält sich dieser Indikator genau wie sein Pendant bei TradingView und stellt es auch so dar. Wir haben zudem ein vollständig übereinstimmendes visuelles Erlebnis sichergestellt.

Hauptmerkmale und Funktionen:

  • 100% TradingView-Kompatibilität: Der Algorithmus verwendet die exakt gleiche Berechnungslogik wie der originale TV-Indikator (basierend auf der RMA-Formel).
  • Beeindruckendes visuelles Design (dynamische Farbverläufe): Ein innovatives 30-stufiges Farbschattierungssystem wird angewendet. Je höher der RSI in die überkaufte Zone (über 70) steigt, desto intensiver wird der rote Hintergrund. Je tiefer er in die überverkaufte Zone (unter 30) fällt, desto kräftiger wird das Grün. Der mittlere Bereich behält den klassischen Lilaton bei.
  • Eingebauter gleitender Durchschnitt (MA): Wie in den neuesten TV-Versionen können Sie eine gleitende Durchschnittslinie (z.B. SMA) aktivieren, die die RSI-Linie glättet und hilft, Trends innerhalb des Oszillators selbst zu erkennen.
  • Automatische Divergenzerkennung: Der Indikator kann automatisch das Chart nach regulären Divergenzen durchsuchen. Wenn eine Abweichung zwischen Preis- und RSI-Trendstärke erkannt wird, zeichnet er Linien und Markierungen (bullisch: grün, bärisch: rot) direkt im Indikatorfenster.
  • Leistungsstarkes Alarmsystem (Pop-up & Ton): Bleiben Sie jederzeit auf dem Laufenden. Der Indikator benachrichtigt Sie, wenn:
    • der RSI die überkaufte/überverkaufte Zone verlässt (klassische Kauf-/Verkaufssignale generiert),
    • die RSI-Linie die MA-Linie tief innerhalb dieser Zonen kreuzt,
    • eine neue Divergenz erkannt wird.

Für wen ist dieser Indikator geeignet?

Wenn Sie es gewohnt sind, RSI auf TradingView zu analysieren, nach perfekt übereinstimmenden Signalen in cTrader suchen und ein sauberes, optisch ansprechendes Design schätzen (ohne manuelles Anpassen der Farben), ist dieser Indikator die ideale Lösung.

Einfach zu bedienen, präzise in der Funktion und dem Original treu!

cGuru

Zusammenfassung

KI-Zusammenfassung
The RSI Indicator is a cTrader implementation of the classic Relative Strength Index oscillator, designed to replicate TradingView’s original indicator using the Running Moving Average (RMA) smoothing method. It provides 100% calculation compatibility with TradingView, ensuring identical signal behavior and visual presentation. Key features include a dynamic 30-level gradient color scheme that visually distinguishes overbought (red) and oversold (green) zones, with a neutral purple mid-range. The indicator supports an optional moving average line (e.g., SMA) to smooth the RSI curve and highlight trends within the oscillator. It also offers automatic detection of regular divergences between price and RSI trends, marking bullish and bearish divergences directly on the chart. A built-in alert system notifies users via pop-up and sound when the RSI exits overbought/oversold zones, crosses the moving average within these zones, or when new divergences are detected. This indicator is suitable for traders familiar with TradingView’s RSI who seek an accurate, visually clear, and feature-rich RSI tool within the cTrader platform.
Indikatorprofil
Indikatorkategorie
Unterstützung und Widerstand
Ausgabetyp
Visualisierung
Datenanforderungen
Tick-Daten
Unterstützte Signale
Wendepunkt
Abweichung

Kundenbewertungen

0.0
Bewertungen: 0
Kundenbewertungen
Bisher gibt es keine Bewertungen für dieses Produkt. Haben Sie es schon ausprobiert? Dann können Sie die erste Person sein, die andere darüber informiert!

Diskussion

Häufig gestellte Fragen (FAQ)

SMA
RSI
Moving Average
Über den cTrader Store verfügbare Produkte, einschließlich Handelsbots, Indikatoren und Plugins, werden von externen Entwicklern bereitgestellt und nur zu Informations- und technischen Zugriffszwecken verfügbar gemacht. cTrader Store ist kein Broker und erbringt keine Anlageberatung, persönlichen Empfehlungen oder eine Garantie für zukünftige Performance.

Mehr von diesem Autor

Indikator
AI
ATR
+27
Trend Is Your Friend cBot - INDICATOR - Professional Grid, Pyramid, Swing & Scalp Trading Indicator
Indikator
AI
ATR
+27
Supertrend Indicator
Indikator
AI
ATR
+27
Nadaraya-Watson Envelope Indicator
Indikator
AI
ATR
+27
Supertrend Indicator
Indikator
AI
ATR
+26
MacD Custom Indicator-Multiple Time Frame
cBot
AI
ATR
+27
RSI Simple Grid cBot - grid trading strategy with RSI (Relative Strength Index) signals
26.8%
Rendite
4.41
Gewinnfaktor
Indikator
AI
ATR
+27
Market Cipher B
Indikator
AI
ATR
+19
Market Cipher A
cBot
AI
ATR
+27
SmartHedge cBot - Your Trading Companion
1.26
Gewinnfaktor
cBot
ATR
RSI
+5
Trend is your friend cBot - Professional Grid, Pyramid, Swing & Scalp Trading System
28%
Rendite
5.27
Gewinnfaktor
Indikator
EMA
SMA
+3
MACD indicator modeled after TradingView, featuring a 4-color momentum histogram, sound/pop-up crossover alerts.

Das könnte Sie auch noch interessieren

Indikator
RSI
Key Levels
+3
MARCs Multi-timeframe market dashboard with trend rows, RSI context, sessions, presets and optional chart levels.
Indikator
Crypto
Signal
+3
Candlestick Signal Finder: cTrader indicator that automatically detects and color-codes key Japanese candlestick pattern
Indikator
AI
ATR
+27
Nadaraya-Watson Envelope Indicator
Indikator
ATR
RSI
+7
Track the Movement of Market Assets with an Oscillator Scanner in Real-Time!
Indikator
Fibonacci
Key Levels
+5
Institutional Nasdaq-100 Auto-Fib Playbook for cTrader. Dynamic ICT 70.5% OTE Engine, NY Session Tracker, Real-Time Poin
Indikator
ATR
SMC
+2
HTF POWER 3 ICT Power of 3 · M1 Precision · H4 Intelligence Auto-detect Accumulation → Manipulation → Distribution
Indikator
AI
ATR
+27
🔮 Smart Bar Predictor - Professional Volatility Forecasting Indicator
Indikator
Channel
Fibonacci
+5
Market maker levels from key price extremes — catch major reversals and corrections in one click. ver1.2
Indikator
ATR
Volume
+1
The UT Bot identify potential trend reversals and momentum shifts.
Indikator
ATR
MSS
+5
Grades ICT Unicorn setups (Breaker Block + FVG confluence) into PRIME / SETUP / WATCH, with retest & RR targets.
Indikator
MACD
Crypto
A simple tool to control market sessions. fixed the display on the weekend.
Indikator
ATR
BTCUSD
+5
Trailing algo 📈 auto-tracks trends 🎯 adapts to volatility 🌟 precise moves 🛡️ retest signals 🚀 no lag, smart market
Indikator
ATR
RSI
+7
Identify bullish and bearish Order Blocks to spot key support/resistance levels and potential trend reversals! 📈🔄
Indikator
Breakout
Institutional Flow Radar scans the chart for abnormal volume events and classifies them into two groups: Capital &Public
Indikator
Shows BUY & SELL signals for 3 & 4 BAR PATTERN (Morning star/ Evening star). It is adjustable and it will SHOW ARROWS.
Indikator
Prop
Forex
+4
HMA MTF 2.0 (Multi-Timeframe )
Indikator
MCDX is a powerful and innovative indicator.
Indikator
Signal
This Fair Value Gap (FVG) indicator is a technical analysis on multi-timeframe.

Preis

95
Verkäufe
171
Kostenlose Installationen