

Volume Profile - Range and Fixed
Indikator
3 käufe
Version 1.0, May 2026
Windows, Mac
Seit 24/03/2026
13
Verkäufe
110
Kostenlose Installationen
Beschreibung
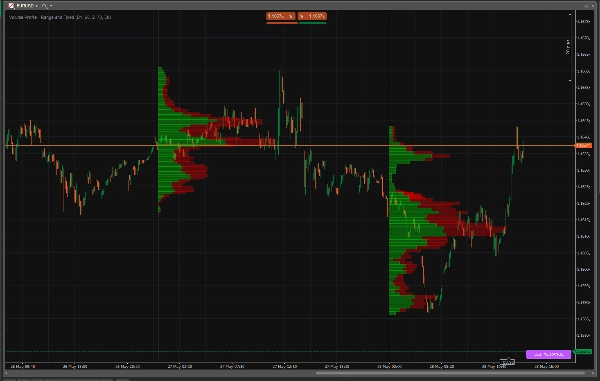
Einfacher, vollständiger und schneller Volumenprofil-Indikator. Dieser bietet Ihnen leistungsstarke Einblicke in den Markt und verlangsamt Ihr Chart nicht.
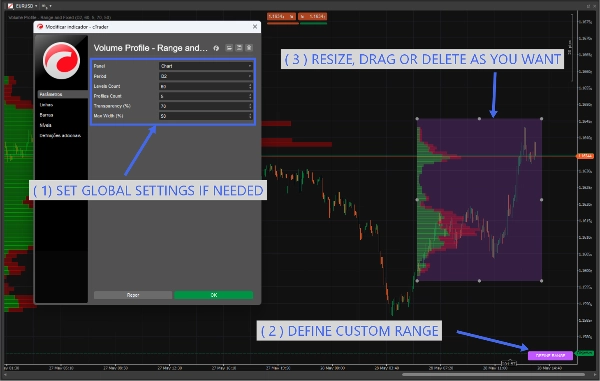
Die Einstellungen sind leicht verständlich, und es gibt Käufer- und Verkäuferdruck pro Ebene.
Auf der Suche nach der perfekten Ergänzung? Schauen Sie sich unsere anderen Indikatoren an! Es gibt keinen AI SLOP, wir machen das, was wirklich effektiv ist, um den Markt zu schlagen. Haben Sie Fragen oder Verbesserungsvorschläge? Lassen Sie es uns im Kommentarbereich dieses Indikators wissen.
Zusammenfassung
KI-Zusammenfassung
Volume Profile - Range and Fixed is a volume profile indicator designed for trading charts. It offers a simple, fast, and comprehensive visualization of volume distribution over a fixed period or a custom range. The indicator highlights buyer and seller pressure at different price levels, providing insights into market structure, order blocks, supply and demand zones, and support and resistance areas. It supports volume data and bar-based chart inputs, and outputs visualizations that help identify breakout, reversal, trend strength, volatility regime, and level touch or break signals. The settings are user-friendly, allowing traders to customize the analysis period and range to suit their strategies. This indicator is categorized under market structure tools and integrates volume analysis with price action concepts to assist in market scanning and decision-making.
Indikatorprofil
Indikatorkategorie
Marktstruktur (SMC)
Ausgabetyp
Visualisierung
Datenanforderungen
Nur Balken
Volumen
Unterstützte Signale
Ausbruch
Wendepunkt
Trendstärke
Volatilität
Level – Berührung
Level – Durchbrechen
Kundenbewertungen
0.0
Bewertungen: 0
Kundenbewertungen
Bisher gibt es keine Bewertungen für dieses Produkt. Haben Sie es schon ausprobiert? Dann können Sie die erste Person sein, die andere darüber informiert!
Diskussion
Häufig gestellte Fragen (FAQ)
Order Block
Volume
Market Structure
Supply & Demand
Market Scanner
Support & Resistance
Über den cTrader Store verfügbare Produkte, einschließlich Handelsbots, Indikatoren und Plugins, werden von externen Entwicklern bereitgestellt und nur zu Informations- und technischen Zugriffszwecken verfügbar gemacht. cTrader Store ist kein Broker und erbringt keine Anlageberatung, persönlichen Empfehlungen oder eine Garantie für zukünftige Performance.






















Preis
Seit 24/03/2026
13
Verkäufe
110
Kostenlose Installationen