
Beschreibung
Showcase:
Market Cipher B ist ein leistungsstarker und dennoch benutzerfreundlicher technischer Analyseindikator, der Ihnen hilft, selbstbewusste Handelsentscheidungen auf den Finanzmärkten zu treffen – von Kryptowährungen über Aktien bis hin zu Forex. Egal, ob Sie Anfänger oder erfahrener Trader sind, dieser Oszillator liefert klare Kauf- und Verkaufssignale und verschafft Ihnen den Vorteil, den Sie benötigen, um volatile Märkte mühelos zu navigieren.
Warum Market Cipher B wählen?
1. Klare Kauf- und Verkaufssignale Der Indikator zeigt optimale Ein- und Ausstiegspunkte mit leicht verständlichen Signalen an. Grüne Punkte signalisieren Kaufgelegenheiten, während rote Punkte anzeigen, wann verkauft werden sollte. Dies macht es jedem einfach, schnell und entschlossen zu handeln, auch ohne tiefgehende technische Kenntnisse.
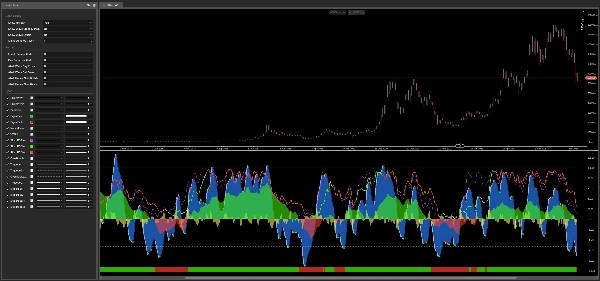
2. Blaue Wellen – Marktmomentum auf einen Blick Market Cipher B verwendet zwei dynamische blaue Wellenlinien, die zeigen, ob der Markt an Stärke gewinnt oder an Schwung verliert. Ihre Kreuzungen heben Schlüsselmomente hervor, um aufkommende Trends zu erkennen oder potenzielle Verluste zu vermeiden. Das Wellensystem bildet den Kernmotor des Indikators und bietet eine zuverlässige Grundlage für alle anderen Signale.
3. Wave Momentum Spread – Ihr Richtungskompass Die gelbe Linie stellt die Differenz zwischen den beiden blauen Wellen dar und fungiert als Echtzeit-Momentum-Messgerät. Wenn sie über null steigt, haben Käufer die Kontrolle; fällt sie darunter, dominieren Verkäufer. Dies hilft Ihnen sofort zu erkennen, ob ein Trend Stärke besitzt oder sich einer Erschöpfung und möglichen Umkehr nähert.
4. Money Flow – Verfolgen Sie, wohin das Geld fließt Die grün-rote Money Flow-Linie zeigt, wohin Investoren ihr Kapital lenken. Berechnet als geglätteter Oszillator über 60 Perioden, offenbart sie, wann institutionelle oder großvolumige Akteure in den Markt ein- oder aussteigen. Kreuzungen über und unter der Null-Linie sind besonders bedeutend, da sie oft größere Kursbewegungen ankündigen und Ihnen einen wichtigen Vorsprung verschaffen.
5. MFI Bar – Sofortiges Kapitalfluss-Signal Eine farbcodierte Leiste am unteren Rand des Indikatorpanels bietet eine schnelle Visualisierung der aktuellen Money Flow-Richtung. Eine grüne Leiste signalisiert bullische Kapitaldominanz, während eine rote Leiste bärischen Druck anzeigt. Farbwechsel auf der Leiste heben potenzielle Trendwenden sofort hervor, ohne dass eine numerische Analyse erforderlich ist – was sie zu einem der schnellsten visuellen Hinweise im Indikator macht.
6. Stochastischer RSI – Präzises Timing Eine violette Stochastik-RSI-Linie, kombiniert mit grünen und roten langsameren RSI-Linien, hilft Ihnen, überkaufte (möglicherweise überbewertete) oder überverkaufte (möglicherweise unterbewertete) Marktbedingungen mit hoher Genauigkeit zu erkennen. Das Dual-Speed-Design – eine schnelle Linie (40 Perioden) und eine langsame Linie (81 Perioden) – ermöglicht es Ihnen, zwischen kurzfristigem Rauschen und echten Momentumwechseln zu unterscheiden, was ideal ist, um hochwahrscheinliche Umkehrpunkte zu finden und häufige Marktfallen zu vermeiden.
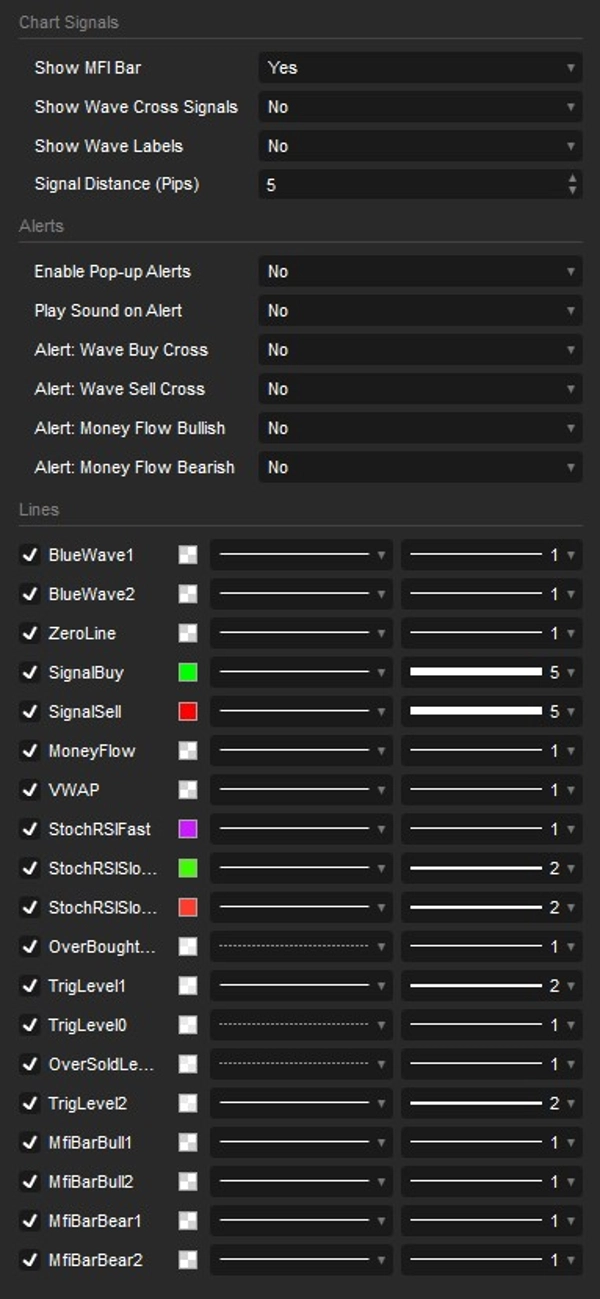
7. Intelligentes Alarmsystem – Verpassen Sie nie ein Signal Market Cipher B beinhaltet ein vollständig konfigurierbares Benachrichtigungssystem, das Sie auch informiert, wenn Sie nicht am Bildschirm sind. Sie können Pop-up-Alerts und Soundbenachrichtigungen für vier wichtige Ereignisse unabhängig ein- oder ausschalten: Wave Buy Cross, Wave Sell Cross, Money Flow Crossing über Null (bullisch) und Money Flow Crossing unter Null (bärisch). Jeder Alarmtyp kann separat aktiviert werden, sodass Sie die volle Kontrolle darüber haben, was für Ihre Handelsstrategie am wichtigsten ist.
8. Flexibilität und Anpassung Market Cipher B funktioniert nahtlos auf jedem Markt und Zeitrahmen, der in cTrader verfügbar ist – von Ein-Minuten-Scalping-Charts bis hin zu wöchentlichen Swing-Trading-Ansichten. Sie haben die volle Kontrolle darüber, welche Komponenten angezeigt werden, einschließlich der MFI-Leiste, Wellenkreuzsignale, Signalbeschriftungen (Kaufen/Verkaufen-Text direkt im Preischart) und aller Alarmtypen. Diese Modularität ermöglicht es Ihnen, den Indikator genau an Ihren Handelsstil anzupassen, ohne visuelles Durcheinander.
Für wen ist Market Cipher B geeignet?
Neue Trader werden die intuitiven Kauf-/Verkaufssignale, farbcodierten Visualisierungen und klaren Referenzniveaus zu schätzen wissen, die den Einstieg in den Handel erleichtern, ohne jahrelange Erfahrung in der technischen Analyse zu erfordern. Der Indikator kommuniziert seine Schlussfolgerungen visuell, sodass Sie weniger Zeit mit dem Lesen von Zahlen verbringen und mehr Zeit haben, Chancen zu nutzen.
Erfahrene Investoren finden Wert in den fortgeschrittenen Komponenten – Money Flow, Wave Momentum Spread und dem dualen Stochastischen RSI – die zusammen eine mehrschichtige Sicht auf die Marktstruktur bieten, geeignet für anspruchsvolle, überzeugende Strategien.
Day- und Swing-Trader profitieren von der Zeitrahmenflexibilität des Indikators und der schnellen Signalgenerierung, die es ihnen ermöglicht, sowohl von schnellen Intraday-Bewegungen als auch von längerfristigen Richtungs-Trends zu profitieren, ohne zwischen mehreren Werkzeugen wechseln zu müssen.
Zusammenfassung
Additional components include a Money Flow line that tracks capital movement by large investors, accompanied by a color-coded Money Flow bar for quick visual cues on market pressure. A dual-speed Stochastic RSI helps identify overbought and oversold conditions, aiding in precise timing for potential reversals.
Market Cipher B supports full customization, allowing users to enable or disable specific features and alerts for key events such as wave crosses and Money Flow shifts. It operates on any timeframe, from minute charts to weekly views, making it suitable for new traders, experienced investors, day traders, and swing traders. The indicator integrates multiple analytical tools into one interface, aiming to provide a comprehensive market overview and assist in making informed trading decisions.
Kundenbewertungen
5 | 67 % | |
4 | 33 % | |
3 | 0 % | |
2 | 0 % | |
1 | 0 % |


