

Opis
Zaawansowana dynamika trendów z oscylatorem Bollingera
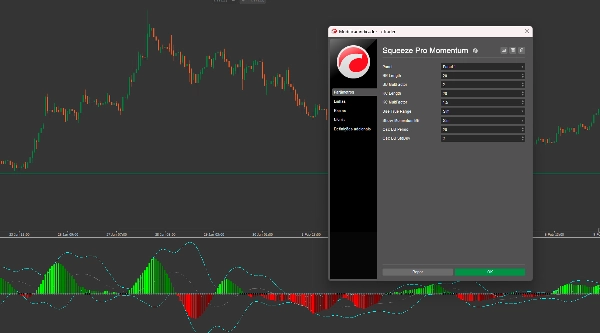
Pakiet Squeeze Pro: Momentum & Volatility Suite to narzędzie klasy instytucjonalnej dla cTrader. W przeciwieństwie do standardowych wskaźników, pakiet ten oferuje dwuwarstwową analizę zachowania rynku: identyfikuje fazę ścisku (kompresję rynku) i monitoruje ekstrema momentum za pomocą wstęg Bollingera obliczanych bezpośrednio na oscylatorze.
Kluczowe innowacje
-
- Momentum Bollinger Bands: Pierwsze tego typu. Stosując BB do histogramu momentum, możesz zidentyfikować poziomy "przekupienia" lub "przesprzedania" momentum — idealne do wyznaczania momentów wyjścia przed wyczerpaniem trendu.
- Wykrywanie ścisku w trzech stanach:
-
- Czarne kropki (Ścisk włączony): Wysoka kompresja. Rynek "napięty" do potężnego wybicia.
- Szare kropki (Ścisk wyłączony): Zmienność rośnie. Ruch się rozpoczął.
- Niebieskie kropki (Brak ścisku): Normalne warunki rynkowe.
- Wygładzanie regresją liniową: Wykorzystuje ulepszony
CalculateLinearRegressionalgorytm do filtrowania szumów cenowych, zapewniając gładki i wiarygodny histogram. - Logika podwójnej nakładki: Działa w osobnym oknie wskaźnika, aby utrzymać wykres cenowy czysty, jednocześnie dostarczając głębokie analityczne wglądy.
Przewodnik wizualnej inteligencji:
-
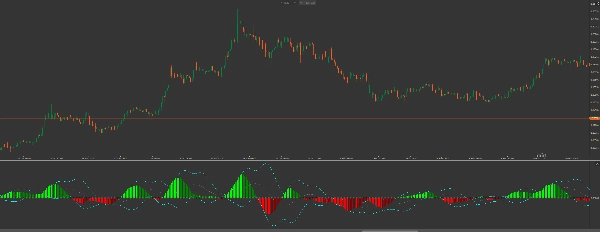
- Histogram (trend i siła)
-
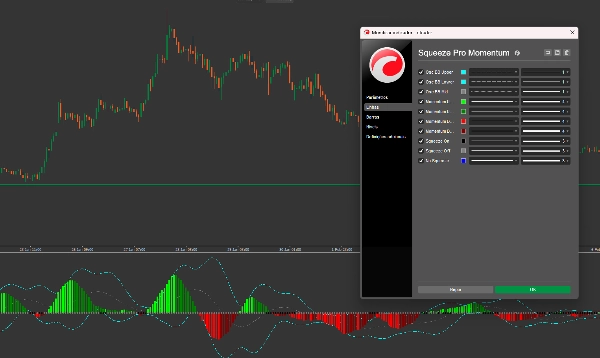
- Limonkowy: Momentum byków przyspiesza (silne kupno).
- Zielony: Momentum byków zwalnia (realizacja zysków).
- Czerwony: Momentum niedźwiedzi przyspiesza (silna sprzedaż).
- Bordowy: Momentum niedźwiedzi zwalnia (wyczerpanie sprzedających).
- Wstęgi oscylatora (linie "cyjanowe")
-
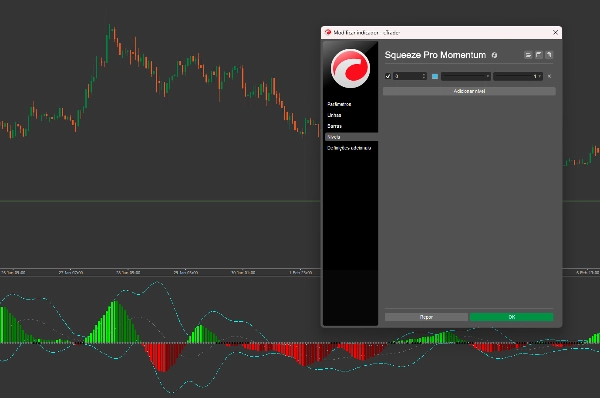
- Gdy słupki histogramu wychodzą poza cyjanowe wstęgi Bollingera, obecny trend znajduje się na statystycznym ekstremum. Szukaj odwróceń lub poważnych korekt, gdy histogram zaczyna cofać się z powrotem do wnętrza tych wstęg.
Strategia handlowa: "Power Breakout"
-
- Zidentyfikuj ścisk: Poczekaj na pojawienie się czarnych kropek na linii zerowej. To oznacza "ciszę przed burzą".
- Potwierdź kierunek: Szukaj pierwszego słupka histogramu w kolorze limonkowym (kupno) lub czerwonym (sprzedaż).
- Wyzwalacz: Wejdź w transakcję, gdy pojawi się Ścisk wyłączony (szara kropka), sygnalizująca uwolnienie energii.
- Wyjście: Zrealizuj zyski, gdy histogram zmieni kolor z limonkowego na zielony LUB gdy histogram osiągnie górną wstęgę oscylatora BB, sygnalizując wyczerpanie.
Dlaczego warto przejść na Squeeze Pro?
Podczas gdy podstawowe wskaźniki pokazują gdzie cena poszła, Squeeze Pro pokazuje presję stojącą za ruchem. Dzięki jednoczesnemu widokowi ścisku i wstęg momentum unikasz wchodzenia w trendy, które są już wyczerpane, i łapiesz wybuchowe ruchy, które inni przegapiają.
Notatka od dewelopera: Ten wskaźnik jest wysoko zoptymalizowany pod kątem API cTrader, zapewniając zerowe opóźnienia wydajności nawet na słabszych maszynach, jednocześnie obsługując skomplikowane obliczenia regresji liniowej w czasie rzeczywistym.
Podsumowanie
Key features include linear regression smoothing to reduce price noise, a dual-overlay display that keeps the price chart uncluttered, and a color-coded histogram that visually represents bullish and bearish momentum strength and changes. When histogram bars move outside the oscillator’s Bollinger Bands (cyan lines), it signals statistically extreme momentum levels, useful for timing entries and exits.
The indicator supports a "Power Breakout" trading strategy: traders wait for squeeze signals, confirm momentum direction via histogram colors, enter trades on squeeze release, and exit when momentum shows signs of exhaustion. This suite provides institutional-grade insights into trend pressure and momentum dynamics, helping traders identify potential explosive moves and avoid exhausted trends.
Opinie klientów
5 | 0 % | |
4 | 100 % | |
3 | 0 % | |
2 | 0 % | |
1 | 0 % |










![Logo „[Hamster-Coder] Moving Average MTF”](https://cdn.ctrader.com/image/webp/b11b98b1-194d-4b8e-b00e-d611826ad159_31226)














