
Volume Meter
Indikator
2 pembelian
Versi 1.0, Sep 2025
Windows, Mac
5.0
Ulasan: 1
Sejak 29/05/2025
3.04M
Volum yang didagangkan
45.22K
Pip dimenangi
29
Jualan
768
Pemasangan percuma
Penerangan
📘 Apa Yang Dilakukan Penunjuk Ini
- Ia menunjukkan jumlah tik (bilangan perubahan harga setiap bar) sebagai histogram.
- Dalam Forex, broker jarang menyediakan jumlah dagangan sebenar, jadi jumlah tik digunakan sebagai pengganti.
- Dalam saham/CFD/niaga hadapan, anda mungkin mendapat jumlah sebenar.
- Ia menindih Purata Pergerakan jumlah (lalai 20 tempoh).
- Ini bertindak sebagai “garis asas” untuk dengan cepat mengenal pasti sama ada jumlah bar semasa adalah luar biasa tinggi atau rendah.
🎯 Cara Menggunakannya sebagai Pengesahan
Penunjuk ini bukan penjana isyarat berdiri sendiri. Sebaliknya, pedagang menggunakannya untuk mengesahkan susunan dari strategi lain:
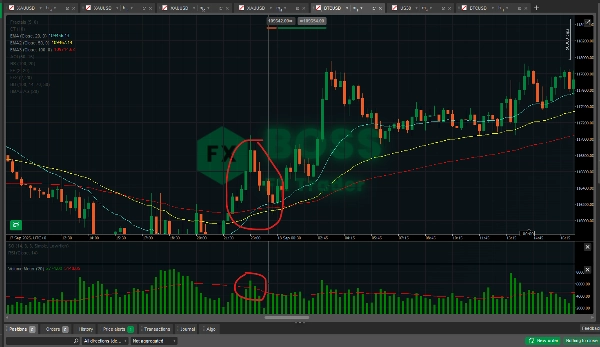
- Pengesahan Pecahan
-
- Jika harga pecah di atas rintangan atau di bawah sokongan, periksa sama ada lilin pecahan mempunyai jumlah di atas MA-nya.
- Jumlah tinggi mengesahkan lebih ramai peserta berada di belakang pergerakan → pecahan lebih boleh dipercayai.
- Pecahan jumlah rendah = peluang lebih tinggi untuk pecahan palsu.
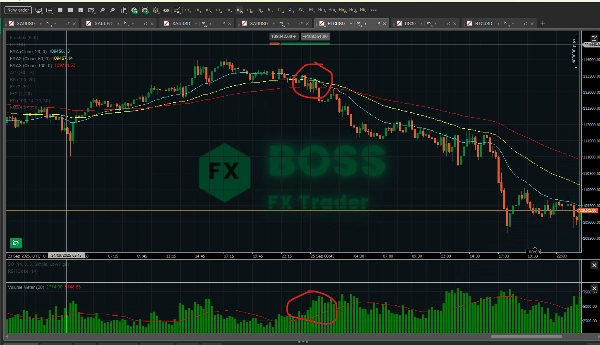
- Sambungan Trend vs. Keletihan
-
- Dalam trend kuat, lilin penarikan balik sering mempunyai jumlah lebih rendah berbanding lilin impuls.
- Jika penarikan balik berlaku pada jumlah rendah dan pergerakan seterusnya disambung dengan jumlah lebih tinggi → mengesahkan sambungan trend.
- Jika anda melihat dorongan trend berterusan tetapi jumlah menurun setiap dorongan → kemungkinan keletihan, bersedia untuk pembalikan.
- Pengesahan Pembalikan
-
- Lilin pembalikan besar (pin bar, lilin menelan, fraktal) lebih kuat jika disokong oleh lonjakan jumlah.
- Contoh: pin bar bullish di sokongan dengan jumlah tinggi = isyarat pembalikan lebih kuat daripada pin bar yang sama dengan jumlah rendah.
- Penapis Isyarat Palsu
-
- Jika sistem utama anda memberi isyarat beli/jual, tetapi jumlah lemah (di bawah purata), anda mungkin memilih untuk tidak mengambil perdagangan itu.
- Membantu mengurangkan perdagangan berlebihan dan menapis bunyi bising.
📊 Keberkesanan
- Dalam Forex: Jumlah tik telah ditunjukkan berkorelasi kuat dengan jumlah dagangan sebenar (70–90% korelasi dalam banyak kajian). Jadi ia berguna, tetapi tidak sempurna.
- Dalam Saham/Niaga Hadapan/CFD: Jumlah sebenar menjadikan ini jauh lebih berkuasa kerana anda mengukur kontrak/saham yang benar-benar didagangkan.
- Sebagai Pengesahan: Ia terbaik digunakan bersama tindakan harga dan penunjuk lain (contohnya, EMA, RSI, fraktal). Bergantung pada jumlah sahaja adalah berisiko.
- Kekuatan: Mengesahkan pecahan, menapis pergerakan palsu, mengenal pasti keletihan.
- Kelemahan: Tidak meramalkan arah sendiri — hanya menambah keyakinan apabila anda mempunyai susunan.
✅ Petua praktikal:
Gunakan penunjuk ini sebagai penapis, bukan pencetus. Contohnya:
- Anda melihat persilangan EMA (isyarat beli).
- Periksa: Adakah jumlah di atas purata pergerakannya? Jika ya → buat perdagangan. Jika tidak → tunggu.
Dengan cara ini anda hanya berdagang apabila momentum disokong oleh penyertaan pasaran.
Ringkasan
Ringkasan AI
Volume Meter is a trading indicator that displays tick volume—the number of price changes per bar—as a histogram. In Forex markets, where real traded volume data is often unavailable, tick volume serves as a proxy, while in stocks, CFDs, and futures, real volume data may be used. The indicator overlays a moving average of volume (default 20-period) to provide a baseline, helping traders identify whether current volume is unusually high or low.
This tool is designed to confirm trading setups rather than generate standalone signals. It assists in validating breakouts by checking if breakout candles have volume above their moving average, indicating stronger market participation. It also helps distinguish trend continuation from exhaustion by comparing volume levels during pullbacks and impulse moves. Additionally, it supports reversal confirmation by highlighting volume spikes on significant reversal candles and filters false signals by advising caution when volume is weak despite buy or sell signals from other systems.
Volume Meter is applicable across various markets including Forex, stocks, indices, commodities, and cryptocurrencies. Its effectiveness is enhanced when combined with price action and other indicators such as EMA or RSI. The indicator aids in improving trade decision confidence by integrating volume analysis as a confirmation and filtering tool.
Profil indikator
Ulasan pelanggan
5.0
Ulasan: 1
5 | 100 % | |
4 | 0 % | |
3 | 0 % | |
2 | 0 % | |
1 | 0 % |
Ulasan pelanggan
October 1, 2025
the first 10 trades should stay boring, and the checklist becomes easier to follow.
Perbincangan
Soalan Lazim
BTCUSD
Forex
Breakout
Indices
EURUSD
Commodities
GBPUSD
NZDUSD
Prop
Supertrend
Crypto
Stocks
XAUUSD
NAS100
USDJPY
Produk yang tersedia melalui cTrader Store, termasuk bot dagangan, indikator dan plugin, disediakan oleh pembangun pihak ketiga dan diberikan akses untuk tujuan maklumat dan teknikal sahaja. cTrader Store bukan broker dan tidak memberikan nasihat pelaburan, syor peribadi atau sebarang jaminan prestasi masa hadapan.


Harga
Sejak 29/05/2025
3.04M
Volum yang didagangkan
45.22K
Pip dimenangi
29
Jualan
768
Pemasangan percuma