
Descrizione
Gap di apertura settimanali e giornalieri — Indicatore NWOG e NDOG
Visualizzazione professionale dei gap di apertura per trader istituzionali e partecipanti retail seri
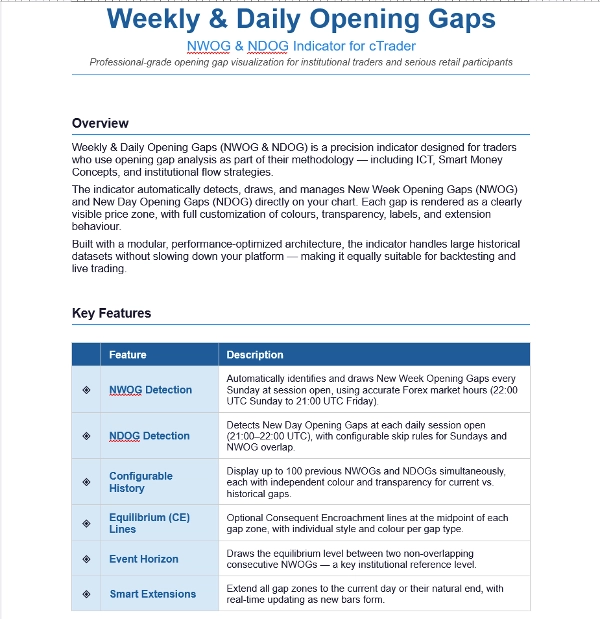
PANORAMICA
I Gap di Apertura Settimanali e Giornalieri (NWOG e NDOG) sono un indicatore di precisione progettato per trader che utilizzano l'analisi dei gap di apertura come parte della loro metodologia — inclusi ICT, Smart Money Concepts e strategie di flusso istituzionale.
L'indicatore rileva automaticamente, disegna e gestisce i Gap di Apertura della Nuova Settimana (NWOG) e i Gap di Apertura del Nuovo Giorno (NDOG) direttamente sul tuo grafico. Ogni gap è rappresentato come una zona di prezzo chiaramente visibile, con completa personalizzazione di colori, trasparenza, etichette e comportamento di estensione.
Costruito con un'architettura modulare e ottimizzata per le prestazioni, l'indicatore gestisce grandi dataset storici senza rallentare la tua piattaforma — rendendolo adatto sia per il backtesting che per il trading live.
CARATTERISTICHE PRINCIPALI
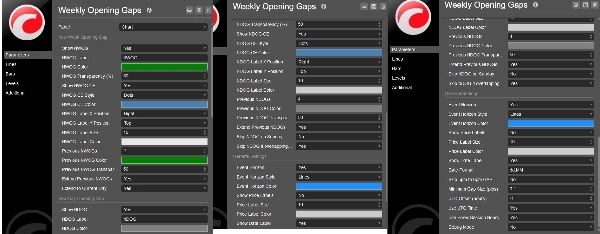
◈ Rilevamento NWOG
◈ Rilevamento NDOG con regole di salto configurabili per le domeniche e sovrapposizione NWOG.
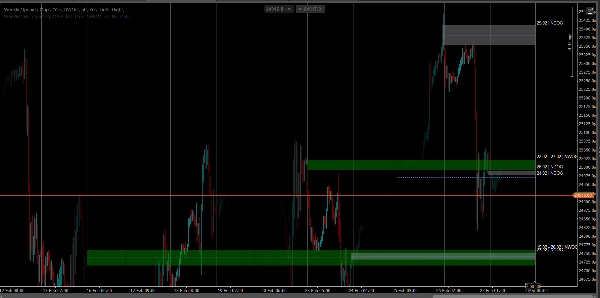
◈ Cronologia Configurabile — Visualizza fino a 100 NWOG precedenti
◈ Linee di Equilibrio (CE)
◈ Orizzonte degli Eventi — Disegna il livello di equilibrio tra due NWOG consecutivi non sovrapposti
◈ Estensioni Intelligenti — Estendi tutte le zone di gap al giorno corrente o al loro naturale termine, con aggiornamento in tempo reale mentre si formano nuove barre.
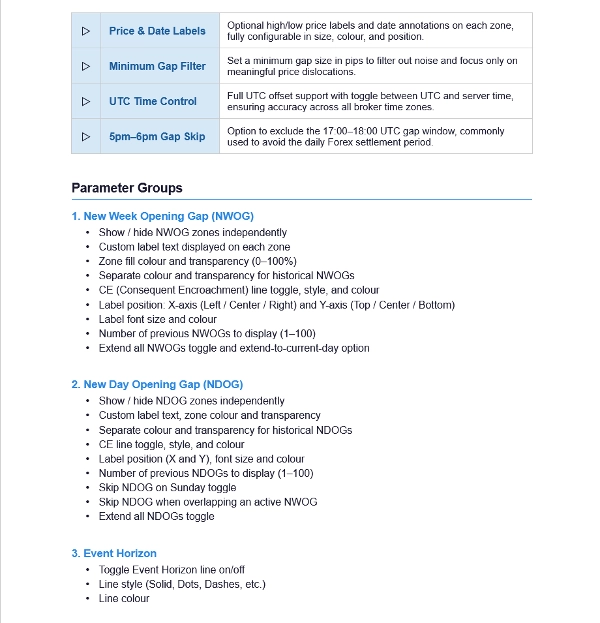
◈ Etichette di Prezzo e Data
◈ Filtro di Gap Minimo
◈ Controllo Orario UTC
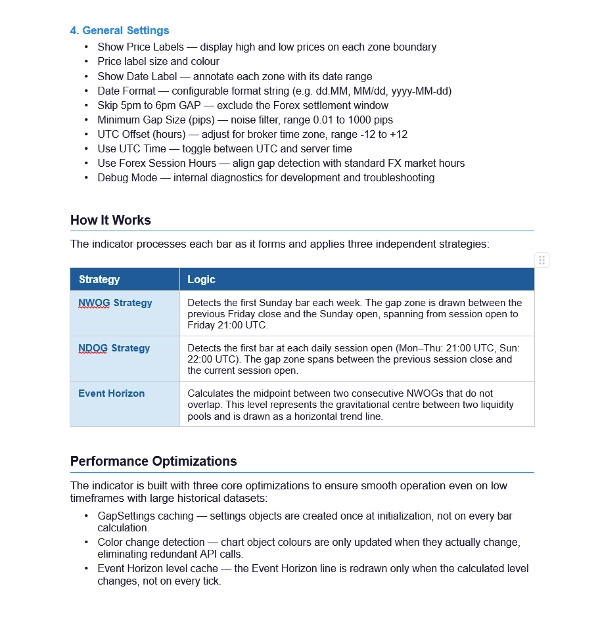
COME FUNZIONA
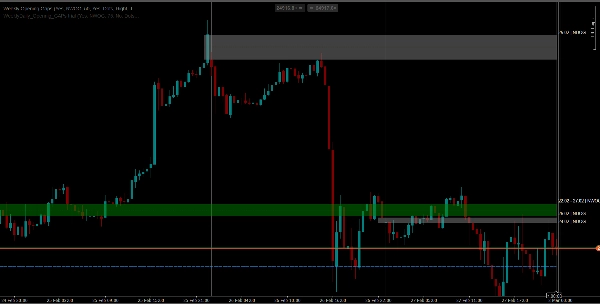
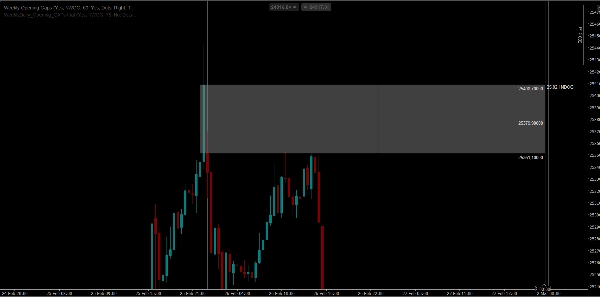
Strategia NWOG — Rileva la prima barra della domenica di ogni settimana. La zona di gap è disegnata tra la chiusura del venerdì precedente e l'apertura della domenica, estendendosi dall'apertura della sessione fino alle 21:00 UTC di venerdì.
Strategia NDOG — Rileva la prima barra di ogni apertura di sessione giornaliera (lun–gio: 21:00 UTC, dom: 22:00 UTC). La zona di gap si estende tra la chiusura della sessione precedente e l'apertura della sessione corrente.
Orizzonte degli Eventi — Calcola il punto medio tra due NWOG consecutivi che non si sovrappongono. Questo livello rappresenta il centro gravitazionale tra due pool di liquidità ed è disegnato come una linea di tendenza orizzontale.
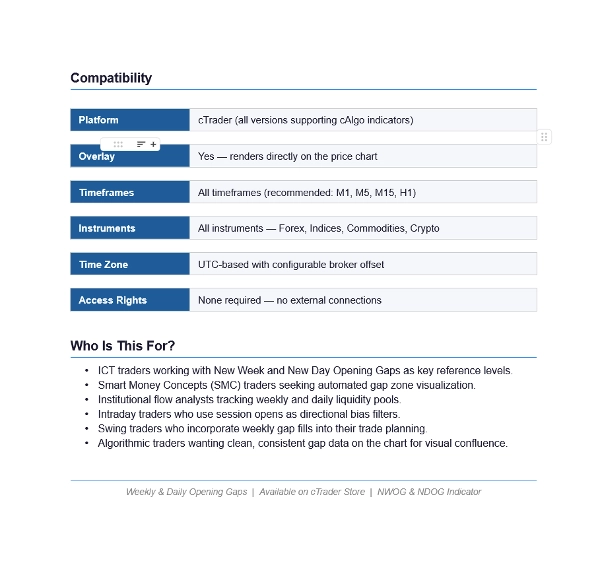
COMPATIBILITÀ
Piattaforma: cTrader (tutte le versioni che supportano gli indicatori cAlgo)
Overlay: Sì — si rende direttamente sul grafico dei prezzi
Timeframe: Tutti i timeframe (consigliati: M1, M5, M15, H1)
Strumenti: Tutti — Forex, Indici, Commodities, C
A CHI È RIVOLTO?
Trader ICT che lavorano con i Gap di Apertura della Nuova Settimana e del Nuovo Giorno come livelli di riferimento chiave
Trader Smart Money Concepts (SMC) che cercano una visualizzazione automatizzata delle zone di gap
Analisti di flusso istituzionale che monitorano pool di liquidità settimanali e giornalieri
Trader intraday che utilizzano le aperture di sessione come filtri di bias direzionale
Trader swing che incorporano i riempimenti di gap settimanali nella loro pianificazione di trading
Trader algoritmici che desiderano dati di gap puliti e coerenti sul grafico per una confluenza visiva
Riepilogo
Recensioni dei clienti
5 | 0 % | |
4 | 100 % | |
3 | 0 % | |
2 | 0 % | |
1 | 0 % |


