
Description
Bloc de rupture CHoCH
https://chartshots.spotware.com/c/69960085a796e
Cet indicateur est conçu pour les traders qui opèrent avec Price Action et Smart Money Concepts (SMC) méthodologies. Utilisation recommandée :
- 🔍 Identifier le CHoCH comme le premier signal d’un possible renversement structurel.
- 👀 Observer la zone d’intérêt générée : c’est la zone où le prix revient généralement avant de continuer dans la nouvelle direction.
- ⏳ Attendre que le prix revienne dans la zone et, à l’intérieur, rechercher une confluence avec les niveaux de Fibonacci (en particulier 0.382, 0.5, 0.618 et 0.786).
- ✅ Confirmer avec une bougie Englobante (si en mode StructureBased) à l’intérieur de la zone pour une entrée plus précise.
- ❌ Le trade est invalidé si le prix viole la limite opposée de la zone, car l’indicateur annule lui-même la zone à ce moment-là.
https://chartshots.spotware.com/c/699600271b05d
📊 1. Analyse de la structure à trois niveaux
L’indicateur analyse le marché à travers trois niveaux hiérarchiques imbriqués, du moins au plus significatif :
- 🔹 Court terme : Détecte les plus hauts et plus bas locaux récents en comparant trois chandeliers consécutifs. Un plus bas local est confirmé lorsque le chandelier du milieu est plus bas que les deux autres. Un plus haut local fonctionne inversement.
- 🔸 Moyen terme : Construit sur les points du court terme. Lorsque les oscillations à court terme forment un motif de plus bas successifs ou de plus hauts successifs (signifiant que trois oscillations consécutives confirment une direction), un point moyen terme est établi.
- 🔺 Long terme : Construit de la même manière mais en utilisant les points moyen terme comme base. C’est le niveau le plus significatif et celui qui déclenche les événements principaux de l’indicateur.
💡 Cette structure en cascade garantit que seuls les mouvements ayant un poids structurel réel génèrent des signaux, filtrant le bruit à court terme.
🔄 2. CHoCH — Changement de caractère
Le CHoCH est l’événement central de l’indicateur. Il se produit lorsque :
- 🟢 CHoCH haussier : Le prix clôture au-dessus d’un précédent plus haut structurel long terme, alors que la direction précédente du marché était baissière. Cela indique que les vendeurs ont perdu le contrôle et que le marché pourrait inverser à la hausse.
- 🔴 CHoCH baissier : Le prix clôture en dessous d’un précédent plus bas structurel long terme, alors que la direction précédente était haussière. Cela indique que les acheteurs ont perdu le contrôle et que le marché pourrait inverser à la baisse.
Lorsqu’un CHoCH est détecté, l’indicateur trace :
- ➡️ Une ligne horizontale au niveau exact de la cassure (avec le style et l’épaisseur configurés)
- 🏷️ Le label "CHoCH" au-dessus de cette ligne
- 🟥🟩 Une zone d’intérêt semi-transparente
🗺️ 3. Zone d’intérêt
Immédiatement après un CHoCH, l’indicateur délimite automatiquement une zone de prix clé :
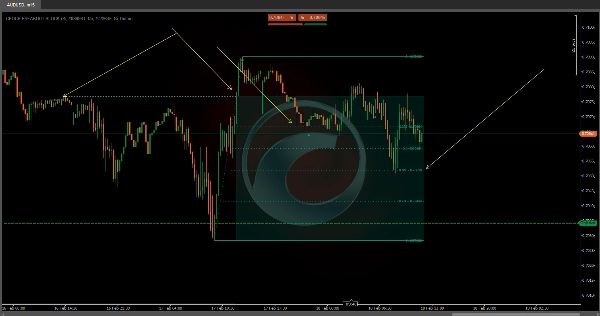
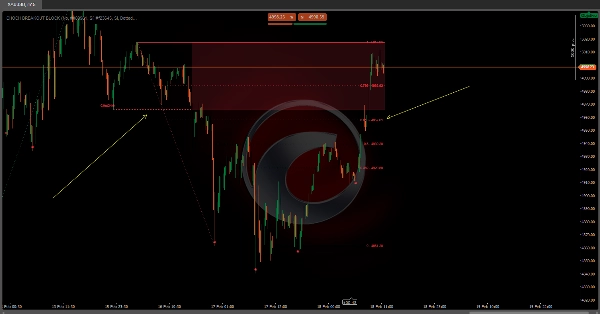
- 🟢 Dans un CHoCH haussier : La zone s’étend du niveau de cassure (CHoCH) jusqu’au point le plus bas trouvé entre l’oscillation structurelle et le moment de la cassure. Cette zone représente l’endroit où le prix pourrait revenir pour chercher de la liquidité avant de continuer à la hausse.
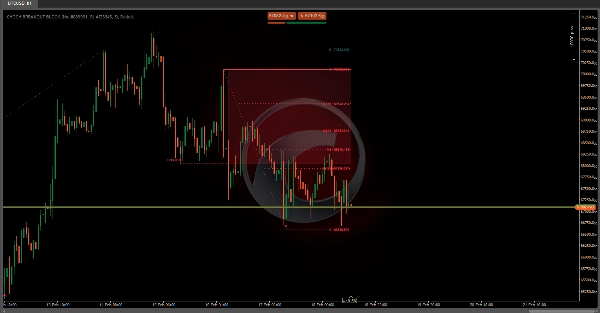
- 🔴 Dans un CHoCH baissier : La zone s’étend du point le plus haut trouvé entre l’oscillation et la cassure jusqu’au niveau CHoCH. Elle représente l’endroit où le prix pourrait revenir pour chercher de la liquidité avant de continuer à la baisse.
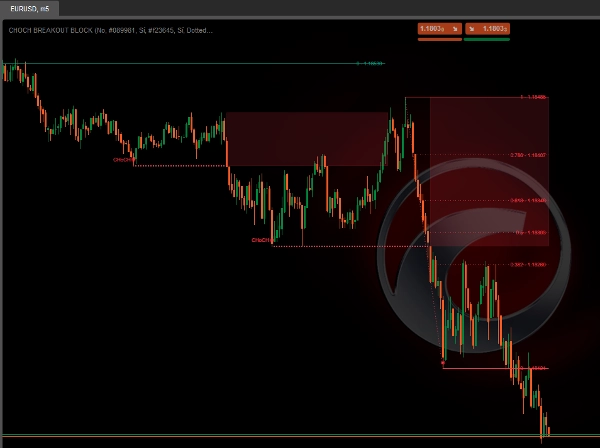
La zone s’étend automatiquement barre par barre tant que le prix respecte ses limites. Dès que le prix viole la limite opposée, la zone cesse de s’étendre — indiquant qu’elle a été testée ou invalidée.
👁️ Comme on le voit sur l’image du graphique, les zones rouges semi-transparentes représentent ces régions d’intérêt baissières après les événements CHoCH détectés.
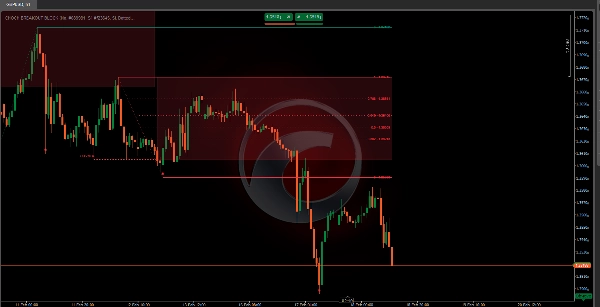
📐 4. Niveaux de Fibonacci automatiques
Après la détection d’un CHoCH, l’indicateur ne trace PAS immédiatement les niveaux de Fibonacci. Les niveaux de Fibonacci apparaissent à une deuxième étape, lorsque le marché confirme que la nouvelle direction a un poids structurel réel. Cela se fait en deux étapes :
Étape 1 — Le CHoCH se produit : 🏷️ La ligne de cassure, le label et la zone d’intérêt sont tracés. Le Fibonacci n’est pas encore visible.
Étape 2 — Le marché forme une nouvelle oscillation long terme dans la direction du CHoCH : 📐 Ce n’est qu’à ce moment que l’indicateur projette automatiquement les niveaux de Fibonacci entre le point de référence de la cassure et cette oscillation nouvellement confirmée.
📌 Exemple : Dans un CHoCH haussier, le Fibonacci sera tracé du point le plus bas trouvé lors de la cassure jusqu’au premier plus haut long terme que le marché forme ensuite. Si le prix monte mais n’a pas encore consolidé cette oscillation structurelle, les niveaux de Fibonacci ne seront pas encore visibles — c’est intentionnel et non un bug.
Une fois activés, les niveaux s’étendent barre par barre tant que la structure reste valide, et sont recalculés automatiquement si une nouvelle cassure structurelle apparaît. Les niveaux disponibles sont :
Niveau
Signification courante
0
Origine du mouvement
Retracement mineur
⭐ Premier retracement pertinent
0.5
⭐ Niveau médian
⭐ Ratio d’or
Variante du ratio d’or
⭐ Retracement profond
1
Extension à 100%
🕯️ 5. Détection de bougie Englobante
L’indicateur inclut la détection de motif de bougie englobante comme signal de confluence supplémentaire :
- ▲ Une englobante haussière apparaît lorsqu’une grande bougie verte absorbe complètement une petite bougie rouge précédente.
- ▼ Une englobante baissière apparaît lorsqu’une grande bougie rouge absorbe complètement une petite bougie verte précédente.
Il existe deux modes d’affichage :
- 📋 Tous : Affiche tous les motifs englobants qui apparaissent sur le graphique.
- 🎯 StructureBased : N’affiche que les motifs englobants qui se produisent à l’intérieur d’une zone d’intérêt active, augmentant significativement la pertinence du signal.
Résumé
When a CHoCH occurs, the indicator marks the breakout level with a horizontal line and label, and automatically creates a semi-transparent interest zone where price is likely to return before continuing in the new direction. This zone extends dynamically as long as price respects its boundaries and is invalidated if price breaks the opposite boundary.
The indicator also projects Fibonacci retracement levels automatically after the market confirms the new trend direction by forming a new long-term swing. Supported Fibonacci levels include 0.236, 0.382, 0.5, 0.618, 0.65, 0.786, and 1. Additionally, it detects bullish and bearish engulfing candle patterns as confluence signals, with options to display all patterns or only those occurring within active interest zones for higher precision.
This tool supports multiple markets including BTCUSD, EURUSD, GBPUSD, NZDUSD, XAUUSD, NAS100, and USDJPY.
Avis clients
5 | 100 % | |
4 | 0 % | |
3 | 0 % | |
2 | 0 % | |
1 | 0 % |


![Logo de "[Stellar Strategies] MARSI Signal Plotter"](https://cdn.ctrader.com/image/webp/7b2b8da6-8f8e-4646-8d4a-4710c516c01e_25567)


