Mô tả
Chỉ báo Pinescriptlabs Store: Pinescriptlabs Store cBots : (cBot) Gold & BTC BreakoutSession Pivots(mới)
PRICE ACTION (Mới)
SmartTrend Support &
Resistance
Lines
Phân tích
Cấu trúc Thị trường
Động
của
Các điểm
Quay đầu
Fibonacci
Hồi quy
Tuyến tính
Đa khung thời gian
Theo dõi
Định hướng Nến
Đa cấp
Tự động
Hỗ trợ và
Kháng cự
Xu hướng
Đường
Tất cả
Hỗ trợ và
Kháng cự
Cấp độ
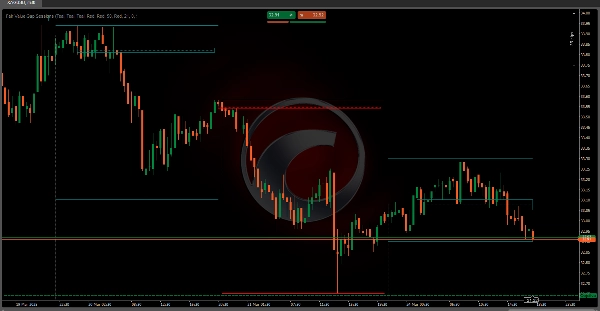
Phiên Fair Value Gap 📊💰
Chỉ báo Fair Value Gap (FVG) là một công cụ giao dịch tinh vi được thiết kế để xác định và làm nổi bật các bất hợp lý tạm thời trên thị trường được gọi là "khoảng trống giá trị công bằng" 🚨 trong các phiên giao dịch cụ thể. Những khoảng trống này đại diện cho những khoảnh khắc giá thị trường di chuyển nhanh chóng ⚡, tạo ra sự mất cân bằng giữa người mua và người bán.
Cơ chế Kỹ thuật Chính 🔧
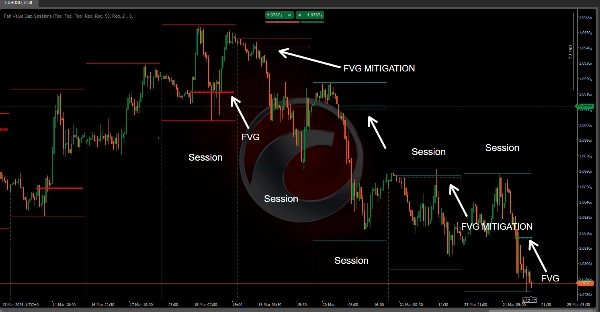
Kiến trúc Dựa trên Phiên 🕒
• Triển khai phương pháp phân tích dựa trên phiên chính xác và có thể cấu hình
• Cho phép nhà giao dịch định nghĩa thời gian bắt đầu phiên tùy chỉnh với hỗ trợ múi giờ UTC hoặc địa phương 🌍
• Tạo ra ranh giới phiên động, đặt lại và theo dõi hành vi thị trường 🔄
Logic Phát hiện Khoảng trống Giá trị Công bằng 🔎
• Sử dụng phân tích hành động giá nâng cao trên nhiều thanh giá liên tiếp
• Xác định khoảng trống bằng cách so sánh:
o Giá cao và thấp của các thanh liên tiếp 📈📉
o Giá đóng cửa của thanh trước đó ✅
o Cấu trúc giá của thanh hiện tại 🔄
Phân loại Khoảng trống 🏷️
Chỉ báo phân biệt giữa hai loại khoảng trống chính:
- Khoảng trống Giá trị Công bằng Tăng 📈
o Xảy ra khi giá nhảy lên trên mức cao trước đó 🔺
o Chỉ báo động lượng thị trường tăng tiềm năng 🚀
o Báo hiệu áp lực mua có thể xảy ra 💸 - Khoảng trống Giá trị Công bằng Giảm 📉
o Xảy ra khi giá giảm xuống dưới mức thấp trước đó 🔻
o Gợi ý động lượng thị trường giảm tiềm năng ⬇️
o Báo hiệu áp lực bán có thể xảy ra 🛑
Ứng dụng Giao dịch 📱💼
Nhận thức Chiến lược 💡
• Giúp nhà giao dịch hình dung các bất hợp lý trên thị trường 🖼️
• Cung cấp cảnh báo sớm về khả năng đảo chiều xu hướng ⚠️
• Cung cấp xác định điểm vào và ra chính xác 🎯
Tính năng Quản lý Rủi ro 🛡️
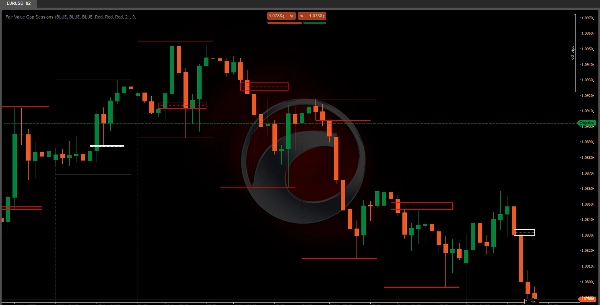
• Hiển thị trạng thái khoảng trống bằng màu sắc 🎨
• Theo dõi "giảm thiểu" khoảng trống (khi giá quay lại vùng khoảng trống) ↔️
• Cho phép tùy chỉnh màu sắc cho các điều kiện thị trường khác nhau 🎨
Trực quan Kỹ thuật 🎨
Chỉ báo tạo ra hai yếu tố hình ảnh chính:
- Hình chữ nhật Khu vực Khoảng trống 🟩
o Đại diện cho phạm vi giá của khoảng trống được xác định 📐
o Mở rộng động trong suốt phiên giao dịch ➡️
o Thay đổi màu sắc dựa trên trạng thái khoảng trống (đang hoạt động/đã giảm thiểu) 🟩➡️🟨 - Đường Cấp độ 📏
o Đặt tại điểm giữa của khoảng trống ⚫
o Giúp nhà giao dịch nhanh chóng xác định vùng giá trung tâm của khoảng trống 📍
o Sử dụng các kiểu đường khác nhau để chỉ trạng thái khoảng trống ➔
Chiến lược Giao dịch Thực tiễn 📝
Chiến lược Tín hiệu Vào lệnh 🚦
• Sử dụng phát hiện khoảng trống như tín hiệu tiếp tục xu hướng tiềm năng 🔄
• Tìm kiếm giá quay lại (giảm thiểu) khoảng trống như xác nhận ✅
• Kết hợp với các chỉ báo kỹ thuật khác để đưa ra quyết định chắc chắn 🤝
Kỹ thuật Quản lý Rủi ro 🛡️
• Đặt stop-loss gần ranh giới khoảng trống ⛔
• Sử dụng điểm giữa khoảng trống như mức hỗ trợ/kháng cự tiềm năng 🪜
• Giám sát giảm thiểu khoảng trống như chỉ báo đảo chiều xu hướng tiềm năng ↔️⚠️
Tính linh hoạt Cấu hình ⚙️
• Thời gian bắt đầu phiên có thể tùy chỉnh ⏰
• Cấu hình múi giờ (UTC/Địa phương) 🌍
Bằng cách hiểu và triển khai đúng chỉ báo Fair Value Gap Sessions, nhà giao dịch có thể có cái nhìn sâu sắc hơn về động lực thị trường, xác định cơ hội giao dịch tiềm năng và đưa ra quyết định thông minh hơn dựa trên các bất hợp lý trong hành động giá. 🧠📈
Tóm tắt
It classifies gaps into two types: bullish gaps, indicating potential upward momentum and buying pressure, and bearish gaps, signaling possible downward momentum and selling pressure. Visually, it represents gaps with dynamic rectangles showing the price range and a midpoint level line to help traders quickly locate the gap's central price zone. Colors and line styles change to reflect the gap's active or mitigated status.
Traders can use this tool to visualize market inefficiencies, receive early warnings of trend reversals, and identify precise entry and exit points. Risk management features include color-coded gap states, tracking of gap mitigation when price returns to the gap zone, and customizable color settings. The indicator supports practical strategies such as using gap detection for trend continuation signals and combining it with other indicators for decision-making. Stop-loss placement near gap boundaries and monitoring gap mitigation for trend reversal are also supported.
Đánh giá của khách hàng
5 | 100 % | |
4 | 0 % | |
3 | 0 % | |
2 | 0 % | |
1 | 0 % |