
Description
Indicateurs du magasin Pinescriptlabs : Pinescriptlabs Store cBots : (cBot) Gold & BTC BreakoutSession Pivots(nouveau)
Projection de liquidité du prix ZigZag
Algorithme intelligent de suivi (nouveau)
Carte de liquidation de levier
Prédiction basée sur Linreg & ATR
SmartTrend Support &
Résistance
Lignes
Analyse
dynamique
de la structure
du marché
des
points de retournement
Régression
linéaire
de Fibonacci
multi-échelle
Gradient de tendance dynamique
Suivi
du biais
multi-niveaux de chandeliers
Support
et résistance
automatiques
de tendance
lignes
Tous
les supports et
résistances
niveaux
Momentum de la plage dynamique
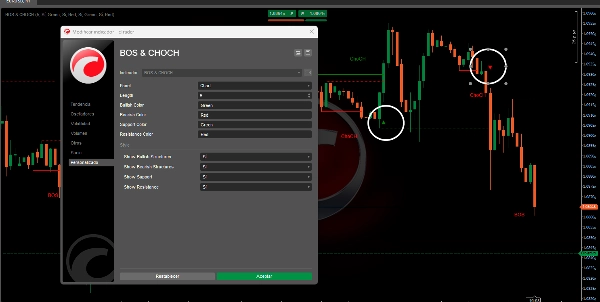
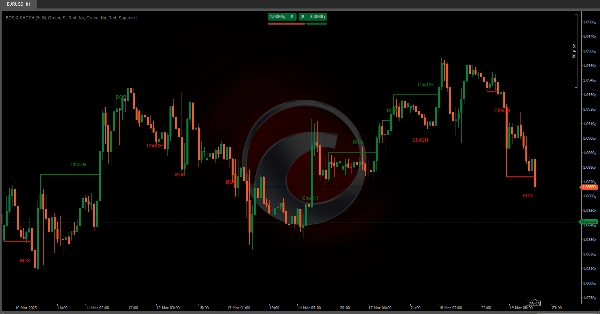
L'algorithme est conçu pour identifier les modèles structurels du marché , en particulier les concepts de Changement de caractère (ChoCH) 🔄 et Rupture de structure (BoS) 💥. Ci-dessous, j'expliquerai en détail ce que fait cet algorithme, son but et comment il identifie ces deux concepts.
Que fait l'algorithme ?
L'algorithme utilise des fractales (hauts et bas locaux) pour déterminer si le prix a changé de comportement ou a cassé une structure précédemment établie. Voici les principales fonctionnalités :
Détection de fractales 📊
- Une fractale haussière se produit lorsqu'il y a un sommet local où les chandeliers des deux côtés sont plus bas. 📈
- Une fractale baissière se produit lorsqu'il y a un creux local où les chandeliers des deux côtés sont plus hauts. 📉
- Ces fractales servent de points de référence pour identifier les changements dans la structure du marché.
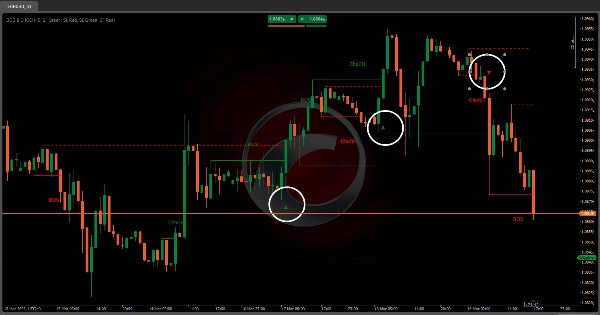
Identification du ChoCH (Changement de caractère) 🔄
- Un ChoCH haussier se produit lorsque le prix dépasse une fractale haussière sans former auparavant une structure baissière complète.
- Un ChoCH baissier se produit lorsque le prix tombe en dessous d'une fractale baissière sans former auparavant une structure haussière complète.
- Cela indique que le marché a changé de caractère (de tendance à consolidation ou inversement).
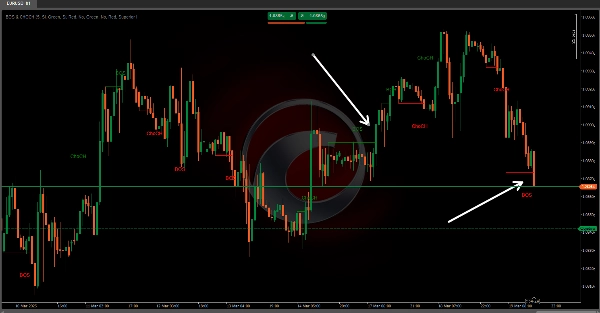
Identification du BoS (Rupture de structure) 💥
- Un BoS haussier se produit lorsque le prix dépasse une fractale haussière après avoir formé auparavant une structure baissière complète.
- Un BoS baissier se produit lorsque le prix tombe en dessous d'une fractale baissière après avoir formé auparavant une structure haussière complète.
- Cela indique que le marché a cassé une structure précédemment établie, ce qui peut être un point d'entrée ou de sortie important.
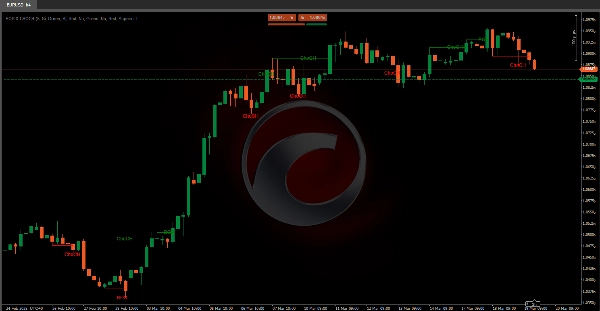
Visualisation des supports et résistances 🛡️
- L'algorithme peut tracer des lignes de support et de résistance basées sur les fractales détectées.
- Il vérifie également si ces lignes sont cassées, marquant les points de cassure avec des icônes visuelles.
Cet algorithme fournit aux traders des informations précieuses sur le comportement du marché en identifiant clairement les changements structurels clés et les opportunités potentielles de cassure. En exploitant les signaux ChoCH 🔄 et BoS 💥, les traders peuvent prendre des décisions plus éclairées concernant les entrées, les sorties et la dynamique globale du marché.
Résumé
Key functionalities include:
- **Fractal Detection:** Identifies bullish fractals (local highs with lower candles on both sides) and bearish fractals (local lows with higher candles on both sides).
- **Change of Character (ChoCH):** Signals when the market changes its behavior, such as shifting from trend to consolidation, by surpassing fractals without forming a complete opposite structure.
- **Break of Structure (BoS):** Indicates when the market breaks a previously established structure, marking potential entry or exit points.
- **Support and Resistance Visualization:** Draws support and resistance lines based on fractals and marks breakout points with visual icons.
This indicator aids traders in understanding market dynamics by clearly highlighting structural changes and breakout opportunities, supporting more informed trading decisions.
Avis clients
5 | 100 % | |
4 | 0 % | |
3 | 0 % | |
2 | 0 % | |
1 | 0 % |


![Logo de "[Stellar Strategies] Inside Bar with Signals"](https://cdn.ctrader.com/image/webp/1d9e8bfa-3b2c-4440-bb37-5856902008a7_30683)


