
Descrição
🚀 Mais de 10.000 traders já usam nossos PRINCIPAIS indicadores🏆
Descubra por que os profissionais nos escolhem – as ferramentas mais poderosas no cTrader (indicadores, algoritmos e cBots) estão esperando por você.
👉 Obtenha todos os nossos sistemas TOP aqui:
_______________________________________________
📌 Indicadores de Estrutura de Mercado
· ✅ AdvancedMarket Structure: Bos, Choch, SwinLevels, Order Blocks, Market Structure& Liquidity Finder
· 🔄 Análise Dinâmica da Estrutura de Mercado de Pontos de Reversão
· 🧱 Bloco de Ordem
· ⛓️ BOS & CHOCH
· 🧠 ICT Poder do 3
· 🌀 Zonas de Polaridade de Mercado
_______________________________________________
🔚 Sistemas Inteligentes de Saída
· 📍 Algoritmo Inteligente de Trailing
_______________________________________________
📐 Indicadores ZigZag
· 🔍 Projeção de Liquidez de Preço ZigZag
· ➖ ZigZag
· 🎯 Rastreador de Extremos Zig-Zag
_______________________________________________
🧱 Indicadores de Suporte & Resistência
· 🟩 Linhas de Suporte & Resistência SmartTrend
· 🧱 Todos os Níveis de Suporte e Resistência
_______________________________________________
📊 Indicadores de Tendência & Canal
· 🔄 Canal de Tendência Automático
· 📊 Supertrend
· ⚡Analisador de Tendência Momentum
· 🧠 Canal de Tendência Adaptativo
· 💥 Sistema de Rompimento de Canal
· 🌈 Gradiente Dinâmico de Tendência
_______________________________________________
💧 Ferramentas de Volume & Liquidez
· 📉 Mapa de Liquidação de Alavancagem
· 🔍 Lacuna de Valor Justo Momentum
· 🕒 Sessões de Lacuna de Valor Justo
_______________________________________________
⚡ Indicadores de Momentum & RSI
· 📈 Disparador de Tendência RSI
· 🚀 Momentum de Alcance Dinâmico
· 🔎 Viés de Vela Multi-Nível
Rastreador
_______________________________________________
🔮 Ferramentas de Previsão & Projeção
· 📐 Previsão Baseada em Linreg& ATR
· 📏 Regressão Linear FibonacciMulti-tempo
· 📈 Projetor de Fluxo de Mercado Alimentado por Volume
🟢 Identificando Blocos de Ordem 🔴
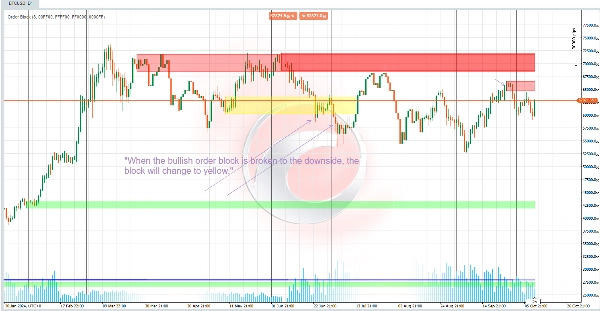
**Bloco de Ordem de Alta 🚀:**
Para identificar um bloco de ordem de alta:
- O código verifica se o preço de fechamento atual ultrapassa o ponto mais alto de um swing anterior ⬆️.
- Se sim e esse swing ainda não foi cruzado, ele é marcado como cruzado. O bloco de ordem é então definido do preço mais baixo ao mais alto nas velas anteriores 📈.
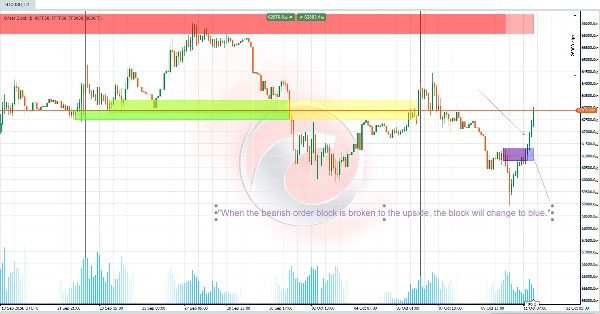
**Bloco de Ordem de Baixa 🔻:**
- Funciona de forma semelhante, mas aplica-se a swings de preço baixo.
- Um bloco de ordem de baixa é criado quando o preço de fechamento atual cai abaixo do ponto mais baixo de um swing ⬇️.
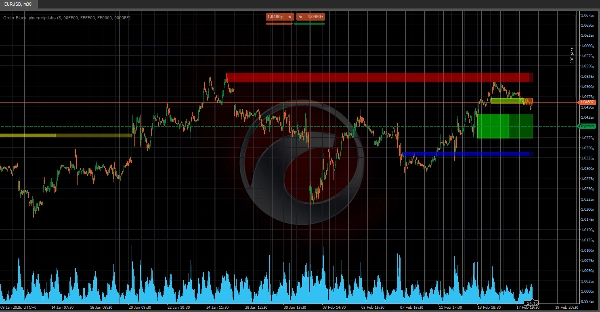
### 💼 Funcionalidade do Bloco de Ordem 📊
Blocos de Ordem representam **zonas de acumulação de alto volume** onde grandes players do mercado podem ter negociado significativamente
Essas áreas frequentemente atuam como potenciais níveis de suporte ou resistência e podem sinalizar continuação ou reversão de tendência 📉📈.
- **Suporte ou Resistência:** Blocos de ordem rompidos podem indicar áreas relevantes de suporte ou resistência, dependendo da tendência anterior 🔄.
- **Continuação ou Reversão:**
- Um rompimento de um bloco de ordem na direção oposta pode indicar uma possível reversão 🔄.
- Romper na mesma direção pode confirmar a continuação de uma tendência 🔗.
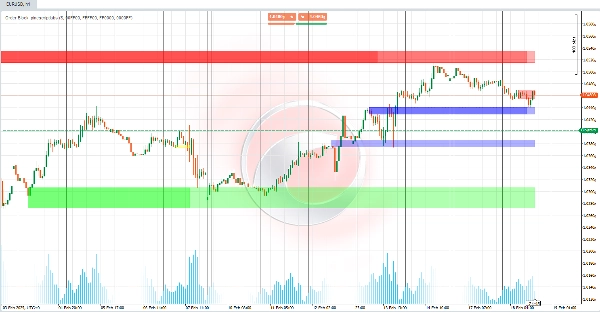
Este indicador é poderoso para identificar **níveis-chave nos gráficos** 📈, ajudando os traders a visualizar áreas importantes com base no comportamento do preço em zonas de alto volume. Perfeito para detectar tendências e movimentos de mercado! 🎯📊
Resumo
Avaliações de clientes
5 | 100 % | |
4 | 0 % | |
3 | 0 % | |
2 | 0 % | |
1 | 0 % |


