
Mô tả
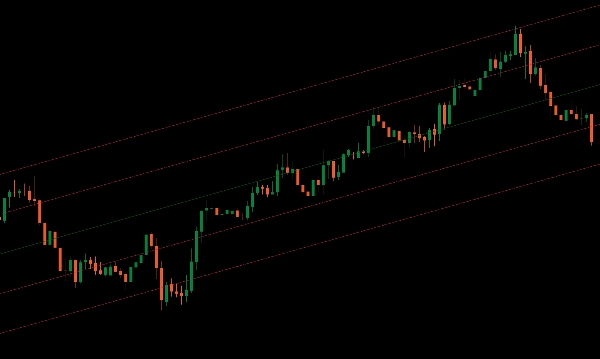
Giới thiệu chỉ báo Kênh Độ lệch Chuẩn cho cTrader, một công cụ mạnh mẽ được thiết kế để giúp bạn hình dung xu hướng thị trường một cách chính xác.
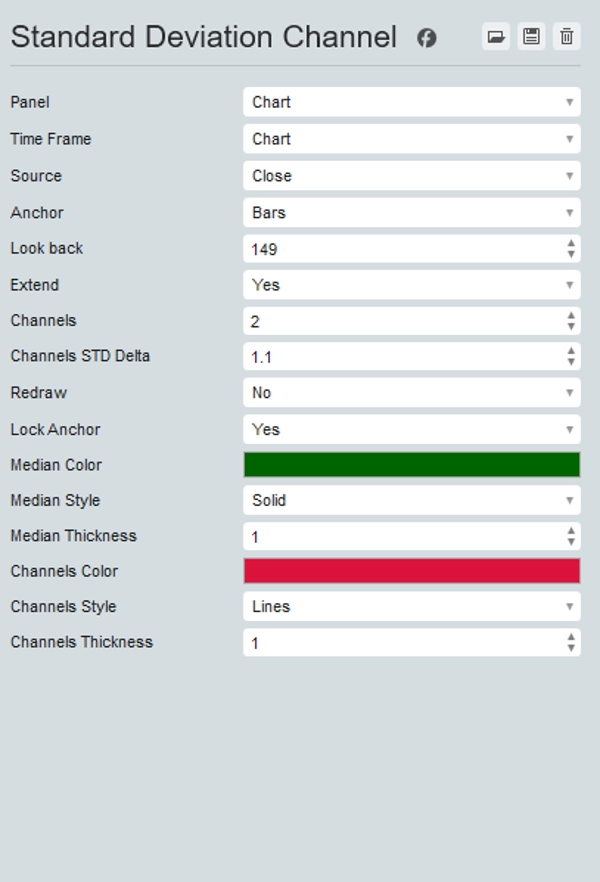
Chỉ báo này hiển thị trung vị của một khoảng thời gian xác định trên biểu đồ của bạn, cung cấp một điểm tham chiếu trung tâm cho các biến động giá.
Ngoài ra, nó cho phép bạn thêm số lượng kênh trên và dưới mong muốn ở các bội số của độ lệch chuẩn, giúp bạn có cái nhìn rõ ràng về độ biến động giá và các vùng có khả năng bứt phá.
Hoàn hảo cho các nhà giao dịch tìm kiếm khả năng phân tích nâng cao, chỉ báo Kênh Độ lệch Chuẩn giúp bạn xác định hướng xu hướng và các điểm đảo chiều tiềm năng một cách dễ dàng.
Nâng cấp bộ công cụ giao dịch của bạn với Kênh Độ lệch Chuẩn để có phân tích thị trường và ra quyết định vượt trội.
Tóm tắt
Đánh giá của khách hàng
5 | 100 % | |
4 | 0 % | |
3 | 0 % | |
2 | 0 % | |
1 | 0 % |


