
Descripción
Indicador de Brecha de Valor Justo
Resumen
El indicador de Brecha de Valor Justo es una herramienta de precisión para traders de acción del precio que desean identificar, rastrear y validar desequilibrios de mercado a corto plazo. Detecta automáticamente brechas de valor justo alcistas y bajistas (FVGs), resalta zonas activas (no mitigadas) en tu gráfico y registra cuando el precio posteriormente llena (mitiga) esas zonas. Ligero y sin repintado (opera en barras cerradas), este indicador está diseñado para un análisis confiable en trading en vivo y backtesting.
Características Clave
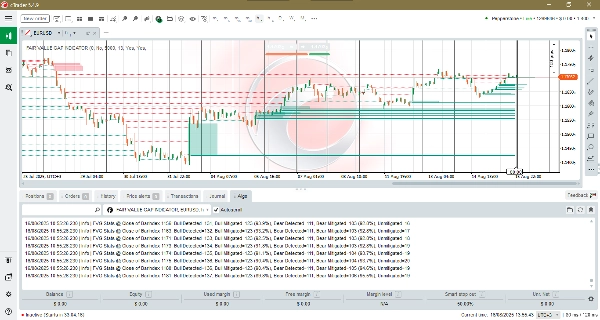
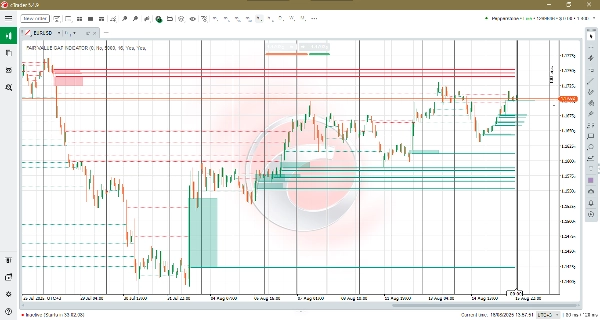
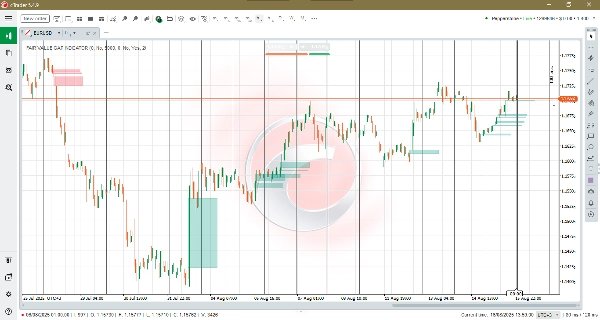
- Detección Automática de FVG: Lógica robusta de 3 barras que identifica zonas de desequilibrio alcistas y bajistas y traza zonas rectangulares limpias en el gráfico.
- Seguimiento de Mitigación: Cuando el precio cierra a través de una zona, el indicador elimina el cuadro y puede dibujar una línea punteada persistente de mitigación para referencia histórica.
- Superposición de Niveles No Mitigados: Muestra los N niveles no llenados más recientes como líneas horizontales en negrita dibujadas desde la barra de detección hasta la barra que se está formando actualmente. Esto facilita escanear visualmente las brechas de valor justo activas (no mitigadas) e identificar rápidamente sus niveles de precio.
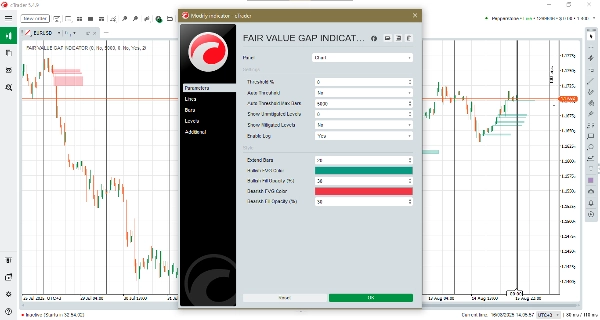
- Umbral Manual y Automático: Elige un umbral relativo fijo o activa el Umbral Automático para que el indicador se adapte a la actividad reciente del mercado.
- Máximo de Barras para Umbral Automático: Controla el tamaño de la ventana deslizante usada para calcular el umbral automático. Valores mayores suavizan el umbral (estable sobre un historial más largo); valores menores lo hacen más sensible a la volatilidad reciente.
- Visuales Personalizados y Proyección: Configura la longitud de extensión (qué tan lejos proyectan las cajas), el color y la opacidad de relleno para zonas alcistas y bajistas para que coincidan con el estilo de tu gráfico.
- Registro en Terminal: Líneas de registro compactas reportan el total de FVGs detectadas, mitigaciones y conteos actuales no mitigados, ideal para validación y ajuste de estrategias.
- Lógica de Barra Cerrada: Diseñado para ejecutarse una vez por barra cerrada para minimizar el repintado.
Beneficios
- Referencias claras para operaciones: Encuentra rápidamente zonas de desequilibrio que pueden actuar como objetivos de retorno, áreas de reacción o referencias para la gestión de operaciones.
- Validación y estadísticas: Usa los registros del terminal y los porcentajes de mitigación para validar señales y ajustar la sensibilidad de tu estrategia.
- Sensibilidad adaptable: Umbral Automático + Máximo de Barras permite que el indicador funcione de manera confiable en mercados tranquilos y volátiles sin necesidad de reajustes manuales constantes.
- Visuales compactos y no intrusivos: Huella visual mínima que mantiene tus gráficos legibles mientras preserva el contexto esencial.
Ideal para
Traders diarios, traders swing y scalpers que dependen de la acción del precio y conceptos de desequilibrio, además de analistas que validan reacciones de flujo de órdenes y rendimiento de estrategias.
Conclusión
El indicador de Brecha de Valor Justo combina detección precisa de desequilibrios con análisis de mitigación y umbral adaptativo, ofreciéndote una vista enfocada y con bajo ruido de los desequilibrios del mercado. Úsalo para detectar posibles retornos de precio, gestionar operaciones de forma más inteligente y medir con qué frecuencia se llenan las zonas en tu mercado.
Resumen
Key features include automated FVG detection, mitigation tracking, and an overlay showing recent unmitigated levels as bold horizontal lines for easy visual scanning. Users can select manual or automatic thresholding to adapt sensitivity to market conditions, with adjustable parameters controlling the responsiveness of the auto threshold. Customizable visual settings allow traders to tailor the appearance of bullish and bearish zones.
The indicator operates on closed bars to minimize repainting, ensuring reliable signals for live trading and backtesting. Terminal logging provides concise statistics on detected gaps and mitigations, aiding validation and strategy tuning.
Suitable for day traders, swing traders, scalpers, and analysts, the Fair Value Gap Indicator supports markets including Forex, indices, commodities, cryptocurrencies, and stocks. It offers a focused, low-noise view of market imbalances to assist in identifying potential price return targets and managing trades.
Valoraciones de clientes
5 | 100 % | |
4 | 0 % | |
3 | 0 % | |
2 | 0 % | |
1 | 0 % |


