
説明
注意: cTrader Windowsのみでテスト済みです。
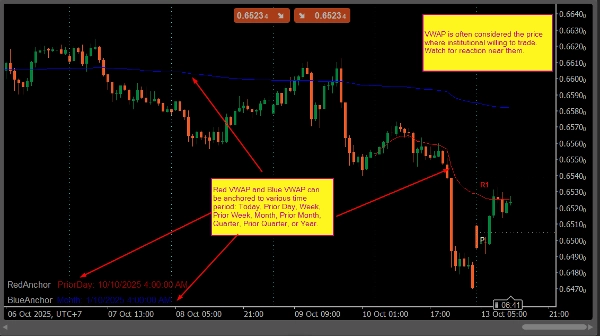
LT_Ind_VWAP はcTrader用の実用的なアンカードVWAPインジケーターです。
2本のVWAPライン(赤と青)を描画し、それぞれを 今日、前日、週、前週、月、前月、四半期、前四半期、または年 の選択した期間にアンカーできます。
このインジケーターは新しい日が始まると自動的に再計算し、チャート上にアクティブなアンカーと日付を直接表示します。VWAPレベルを使って公正価値、トレンドのバイアス、または平均回帰領域を追跡するトレーダー向けに設計されています。
主な特徴
- 独立したアンカーを持つ2本のVWAPライン
- 対応アンカー: 今日、前日、週、前週、月、前月、四半期、前四半期、年
- セッション変更時の自動再計算
- チャート上に表示されるアンカー情報
- シンプルな設定、最小限のリソース使用
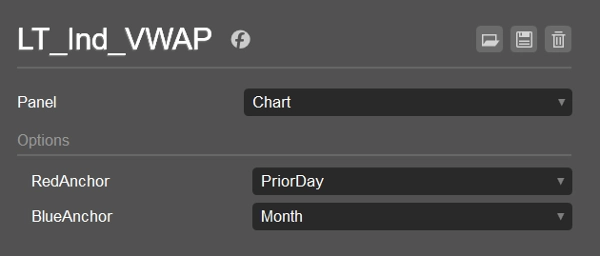
デフォルト設定
- 赤VWAP: 前日
- 青VWAP: 月
使用例
- 日中の価格を前日のVWAPと比較する
- スイングバイアスのために月次または四半期のVWAPを監視する
- 短期と長期のVWAPレベルの合流点を見つける
概要
AIによる概要
LT_Ind_VWAP is an anchored VWAP (Volume Weighted Average Price) indicator designed for the cTrader platform (Windows version). It displays two independent VWAP lines—red and blue—each anchored to selectable time periods including Today, Prior Day, Week, Prior Week, Month, Prior Month, Quarter, Prior Quarter, or Year. The indicator automatically recalculates at the start of a new trading session and shows the active anchor and date on the chart for easy reference. Its primary use cases include comparing intraday prices with prior-day VWAP, monitoring monthly or quarterly VWAP for swing trading bias, and identifying confluence between short- and long-term VWAP levels. The default settings anchor the red VWAP to the prior day and the blue VWAP to the current month. LT_Ind_VWAP offers a simple setup with minimal resource consumption, making it suitable for traders who rely on VWAP levels to assess fair value, trend direction, or mean-reversion zones across various markets such as Forex, indices, commodities, cryptocurrencies, and stocks.
インジケーターのプロフィール
カスタマーレビュー
4.5
レビュー: 2
5 | 50 % | |
4 | 50 % | |
3 | 0 % | |
2 | 0 % | |
1 | 0 % |
カスタマーレビュー
October 26, 2025
ディスカッション
よくあるご質問
Prop
Forex
Indices
Commodities
Crypto
Stocks
VWAP
cTrader Storeで入手可能な取引ボット、インジケーター、プラグインなどの商品は、第三者の開発者が提供するものであり、情報と技術の取得のみを目的としてご利用いただけます。cTrader Storeはブローカーではなく、投資助言や個人的な推奨を行うことも、将来のパフォーマンスを保証することもありません。


価格
登録日 25/09/2024
34
販売