
LT_Ind_SRZones
อินดิเคเตอร์
3 การซื้อ
เวอร์ชัน 1.0, Oct 2025
Windows, Mac
4.6
รีวิว: 3
คำอธิบาย
หมายเหตุ: ทดสอบบน cTrader Windows เท่านั้น
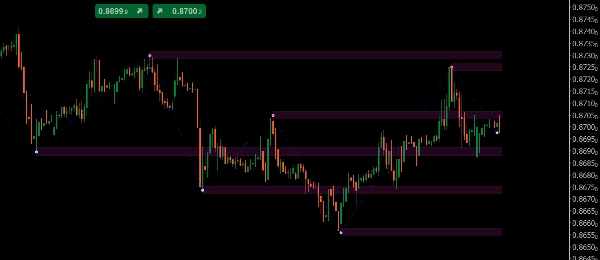
LT_Ind_SRZones ตรวจจับจุดสูง/ต่ำของสวิง รวมสวิงที่อยู่ใกล้กันเป็น โซนแนวรับ/แนวต้าน และช่วยให้กราฟของคุณเน้นไปที่ระดับที่เกี่ยวข้องมากที่สุดรอบราคาปัจจุบัน
สิ่งที่มันวาด
- โซน: แถบที่มีการไล่ระดับสีสร้างจากสวิงที่ถูกรวมกัน
- จุดสวิงสูง/ต่ำ
- เส้นซิกแซก สำหรับอ่านโครงสร้างอย่างรวดเร็ว
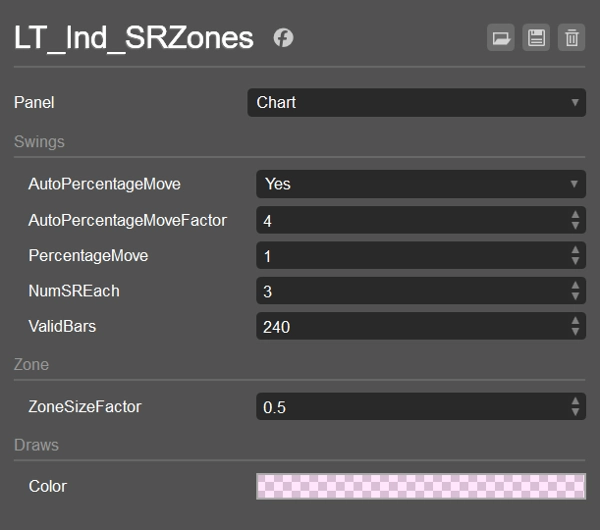
การควบคุมหลัก
- AutoPercentageMove (bool) + AutoPercentageMoveFactor (double)
ปรับความไวของสวิงโดยอัตโนมัติ ปิดใช้งานเพื่อใช้ PercentageMove ด้วยตนเอง - PercentageMove (double)
การเคลื่อนไหวขั้นต่ำ (เป็น %) เพื่อสร้างสวิงเมื่อปิด Auto - ZoneSizeFactor (double)
ความสูงของโซน =ZoneSizeFactor × ATR. - NumSREach (int)
จำนวน โซนบนสุด ที่เก็บไว้ เหนือ และ ใต้ ราคาปัจจุบัน - ValidBars (int)
ไม่สนใจสวิงที่เก่ากว่าจำนวนแท่งนี้ - สี / สไตล์การแสดงผล
สีเติมโซน (พร้อมความโปร่งใส), สไตล์สวิง/ซิกแซก
ตรรกะการจัดลำดับ & กรอง (วิธีเลือกโซน)
- รวบรวมสวิง จากล่าสุดย้อนหลัง, เฉพาะแบบถาวร และ ไม่เก่ากว่า
ValidBars. - นับสวิง เหนือ และ ใต้ ราคาปัจจุบัน (รวมถึงสวิงที่ค่าตกอยู่ในครึ่งหนึ่งของโซน) หยุดเมื่อทั้งสองด้านถึง
NumSREach. - สำรอง: หากด้านใดไม่มีสวิงที่เหมาะสม ให้เพิ่ม สวิงเก่าหนึ่งจุด สำหรับด้านนั้น
- รวม: สำหรับแต่ละสวิงที่มีสิทธิ์, รวม เข้ากับโซนที่มีอยู่ (
CanMerge) หรือ สร้าง โซนใหม่ - จัดอันดับ & เลือก:
-
- เหนือราคา: เรียงโซนตาม (สูงสุด − ราคา) จากน้อยไปมาก, จากนั้นตาม MostRecentIndex จากมากไปน้อย; เลือก
NumSREach. - ใต้ราคา: เรียงตาม (ราคา − ต่ำสุด) จากน้อยไปมาก, จากนั้นตาม MostRecentIndex จากมากไปน้อย; เลือก
NumSREach. - รวม สองรายการ → โซนสุดท้ายที่แสดง
- เหนือราคา: เรียงโซนตาม (สูงสุด − ราคา) จากน้อยไปมาก, จากนั้นตาม MostRecentIndex จากมากไปน้อย; เลือก
สิ่งนี้ช่วยให้การแสดงผล สะอาด, ใกล้เคียง, และล่าสุด ในขณะที่ยังจัดการกับกรณีขอบเขตได้
ค่าเริ่มต้น
- AutoPercentageMove = true, AutoPercentageMoveFactor = 4
- PercentageMove = 1.0 (ใช้เมื่อ Auto = false)
- NumSREach = 1
- ValidBars = 240
- ZoneSizeFactor = 0.5 (ความสูงโซน = 0.5 × ATR)
- สีโซน = #21FF33E0 (โปร่งแสงบางส่วน)
- สวิงสูง = #FFFF999A, สวิงต่ำ = #FF99DFF9, ซิกแซก = สีน้ำเงิน (จุด)
กรณีการใช้งาน
- ทำเครื่องหมาย โซนแนวรับ/แนวต้าน ใกล้เคียงสำหรับการเข้า, การขายบางส่วน หรือการตั้งจุดหยุด
- เฝ้าดู การเปลี่ยนแปลงโซน (จากแนวรับ → แนวต้าน และในทางกลับกัน)
- รวมกับ VWAP/Pivots เพื่อความสอดคล้อง
ใช้งานได้กับสัญลักษณ์และกรอบเวลาทุกชนิด น้ำหนักเบาและพร้อมสำหรับการเทรดสดหรือการทดสอบย้อนหลัง
สรุป
สรุปโดย AI
LT_Ind_SRZones is an indicator designed for cTrader Windows that automatically identifies and displays support and resistance zones derived from swing highs and lows. It detects swing points, merges nearby swings into shaded support/resistance zones, and highlights the most relevant levels around the current price to maintain a clear chart view. The indicator also plots swing high/low points and a ZigZag path for quick structural analysis.
Key adjustable parameters include automatic or manual swing sensitivity settings, zone size based on a factor of the Average True Range (ATR), the number of top zones to display above and below the current price, and the maximum age of swings considered. The indicator filters and ranks zones by proximity and recency, ensuring the display focuses on recent and nearby levels.
LT_Ind_SRZones works on any symbol and timeframe, supporting markets such as Forex, indices, commodities, cryptocurrencies, and stocks. It is suitable for live trading and backtesting. Typical use cases include marking nearby support/resistance zones for trade entries, stops, or partial exits, monitoring zone flips (support to resistance and vice versa), and combining with other indicators like VWAP or pivots for confluence.
โปรไฟล์อินดิเคเตอร์
รีวิวจากลูกค้า
4.6
รีวิว: 3
5 | 67 % | |
4 | 33 % | |
3 | 0 % | |
2 | 0 % | |
1 | 0 % |
รีวิวจากลูกค้า
October 22, 2025
October 15, 2025
the routine feels easier to keep, but the chart still needs a human read.
การสนทนา
คำถามที่พบบ่อย
Prop
Forex
Indices
Commodities
Crypto
Stocks
ผลิตภัณฑ์ที่มีให้บริการผ่าน cTrader Store รวมถึงบอทการเทรด อินดิเคเตอร์ และปลั๊กอิน มีให้บริการโดยนักพัฒนาบุคคลที่สามและมีไว้เพื่อวัตถุประสงค์ในการเข้าถึงข้อมูลและทางเทคนิคเท่านั้น cTrader Store ไม่ใช่โบรกเกอร์และไม่ได้ให้คำแนะนำการลงทุน คำแนะนำส่วนบุคคล หรือการรับประกันผลการดำเนินงานในอนาคต


!["[Hamster-Coder] Pivot Points MTF" โลโก้](https://cdn.ctrader.com/image/webp/4c143e5a-309c-40e3-a578-f04d1e133ffa_31159)


ราคา
ตั้งแต่ 25/09/2024
34
การขาย