
Simple ICT Concepts
อินดิเคเตอร์
3 การซื้อ
เวอร์ชัน 1.0, Dec 2025
Windows, Mac
4.0
รีวิว: 1
คำอธิบาย
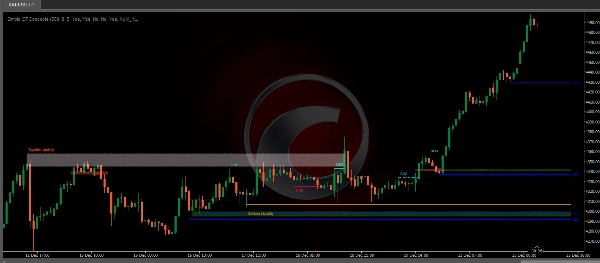
ตัวชี้วัด Simple ICT Concepts เป็นเครื่องมือที่ทรงพลังที่ออกแบบมาเพื่อช่วยเทรดเดอร์ในการประยุกต์ใช้หลักการของวิธีการ Inner Circle Trader (ICT) ตัวชี้วัดนี้มุ่งเน้นไปที่การระบุโซนสำคัญ เช่น ระดับสภาพคล่อง, แนวรับและแนวต้าน, และโครงสร้างตลาด ซึ่งทำให้เป็นทรัพย์สินที่มีค่าสำหรับเทรดเดอร์ที่ใช้แนวคิดราคาและสมาร์ทมันนี่
คุณสมบัติหลัก
โครงสร้างตลาด:
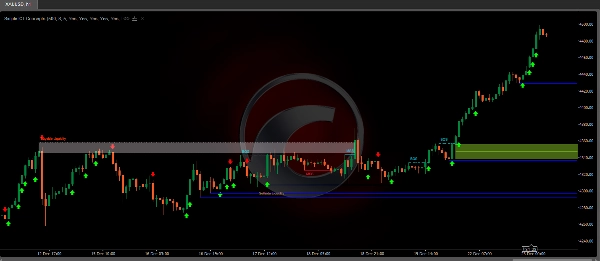
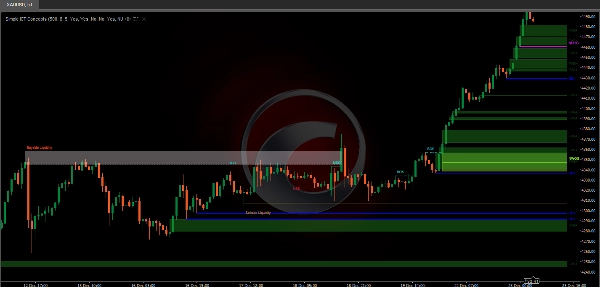
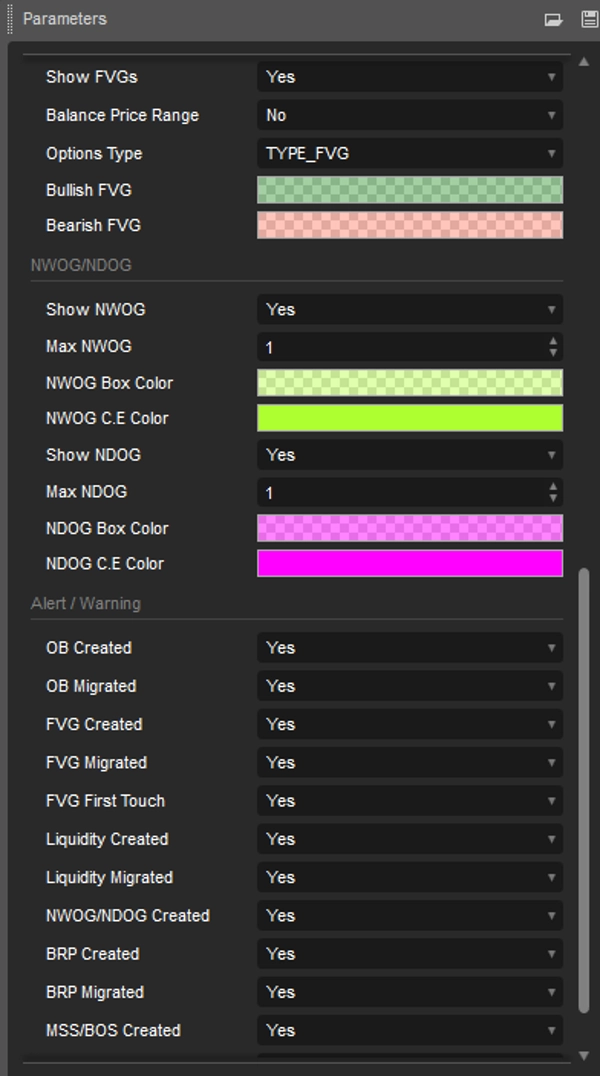
ป้ายโครงสร้างตลาดถูกสร้างขึ้นจากราคาที่ทำลายจุดสวิงก่อนหน้า ซึ่งช่วยให้ผู้ใช้สามารถกำหนดแนวโน้มตลาดปัจจุบันตามการเคลื่อนไหวของราคาได้มีป้ายโครงสร้างตลาดสองประเภทที่รวมอยู่ด้วย:Market Structure Shift (MSS)Break Of Structure (BOS)MSS เกิดขึ้นเมื่อราคาทำลายจุดสวิงต่ำในแนวโน้มขาขึ้นหรือจุดสวิงสูงในแนวโน้มขาลง ซึ่งเน้นถึงการกลับตัวที่เป็นไปได้สิ่งนี้มักถูกติดป้ายว่า "CHoCH" แต่ ICT กำหนดให้เป็น MSS ในขณะที่ป้าย BOS เกิดขึ้นเมื่อราคาทำลายจุดสวิงสูงในแนวโน้มขาขึ้นหรือจุดสวิงต่ำในแนวโน้มขาลงการเกิดจุดสวิงเหล่านี้เกิดจากการย้อนกลับ (inducements) ที่เน้นการล่าหาสภาพคล่องในกรอบเวลาที่ต่ำกว่าจุดสวิงสำคัญ: Higher Highs (HH) และ Lower Lows (LL), Higher Lows (HL) และ Lower Highs (LH)การเคลื่อนที่:การเคลื่อนที่คือสถานการณ์ที่ราคาสร้างแท่งเทียนติดต่อกันที่มีความรู้สึกเดียวกัน (กระทิง/หมี) โดยมีตัวแท่งใหญ่และเงาสั้นสิ่งเหล่านี้สามารถระบุได้ทางเทคนิคโดยการมีความสัมพันธ์อัตโนมัติในทางบวก (การเปลี่ยนแปลงจากปิดเป็นเปิดมีแนวโน้มที่จะตามด้วยการเปลี่ยนแปลงที่มีเครื่องหมายเดียวกัน) รวมถึงการรวมตัวของความผันผวน (การเปลี่ยนแปลงใหญ่ตามด้วยการเปลี่ยนแปลงใหญ่)การเคลื่อนที่สามารถเป็นสาเหตุของการก่อตัวของความไม่สมดุลรวมถึงโครงสร้างตลาด ซึ่งอาจเกิดจากการดำเนินการเต็มรูปแบบของคำสั่ง metaความไม่สมดุลของปริมาณ:ความไม่สมดุลของปริมาณ (V.I.) เกิดขึ้นเมื่อมีพื้นที่ราคาที่ไม่มีตัวแท่งเทียนอยู่ มีการเคลื่อนไหวขึ้นลงในส่วนที่ซ้อนทับของไส้เทียน แต่เนื่องจากปริมาณส่วนใหญ่จะอยู่ในตัวแท่งเทียน เราจึงเรียกสิ่งนี้ว่าความไม่สมดุลของปริมาณบล็อกคำสั่ง:บล็อกคำสั่ง ICT (Inner Circle Trader) คือพื้นที่ราคาบนแผนภูมิที่นักลงทุนสถาบันขนาดใหญ่วางคำสั่งซื้อหรือขายจำนวนมาก บล็อกคำสั่งเป็นแนวคิดสำคัญในการเทรด เพราะช่วยให้เทรดเดอร์ระบุระดับแนวรับและแนวต้านที่เป็นไปได้ และคาดการณ์การกลับตัวของราคาสภาพคล่อง:ระดับสภาพคล่องฝั่งซื้อ/ฝั่งขายเน้นระดับราคาที่ผู้เข้าร่วมตลาดอาจวางคำสั่งจำกัด/หยุดระดับสภาพคล่องฝั่งซื้อจะรวบรวมคำสั่งหยุดขาดทุนของเทรดเดอร์สั้นและคำสั่งจำกัดของเทรดเดอร์ยาว ในขณะที่ระดับสภาพคล่องฝั่งขายจะรวบรวมคำสั่งหยุดขาดทุนของเทรดเดอร์ยาวและคำสั่งจำกัดของเทรดเดอร์สั้นระดับเหล่านี้สามารถมีบทบาทที่แตกต่างกัน ผู้เข้าร่วมตลาดที่มีข้อมูลมากขึ้นอาจมองระดับเหล่านี้เป็นแหล่งสภาพคล่อง และเมื่อสภาพคล่องเหนือระดับเฉพาะลดลง จะพบในพื้นที่อื่นFVG/IFVG:ช่องว่างมูลค่ายุติธรรม: การก่อตัวของแท่งเทียนสามแท่งที่เงาของแท่งเทียนที่อยู่ติดกับแท่งกลางไม่ทับซ้อนกัน ซึ่งเน้นพื้นที่ช่องว่างช่องว่างมูลค่ายุติธรรมโดยนัย: แตกต่างจากช่องว่างมูลค่ายุติธรรม ช่องว่างมูลค่ายุติธรรมโดยนัยมีเงาของแท่งเทียนที่อยู่ติดกับแท่งกลางทับซ้อนกัน พื้นที่ช่องว่างถูกสร้างขึ้นจากค่าเฉลี่ยระหว่างเงาที่เกี่ยวข้องและขอบเขตที่ใกล้ที่สุดของตัวแท่งเทียนช่วงราคาที่สมดุล: ช่วงราคาที่สมดุลเกิดขึ้นเมื่อช่องว่างมูลค่ายุติธรรมทับซ้อนกับช่องว่างมูลค่ายุติธรรมก่อนหน้า โดยพื้นที่ทับซ้อนกันกลายเป็นพื้นที่ไม่สมดุลNWOG/NDOG:ตัวชี้วัดนี้แสดงช่องว่างเปิดสัปดาห์ใหม่ (NWOG) และช่องว่างเปิดวันใหม่ (NDOG) NWOG คือช่องว่างระหว่างราคาปิดวันศุกร์และราคาเปิดวันอาทิตย์ NDOG คือช่องว่างระหว่างราคาเปิดและราคาปิดของวันก่อนหน้า
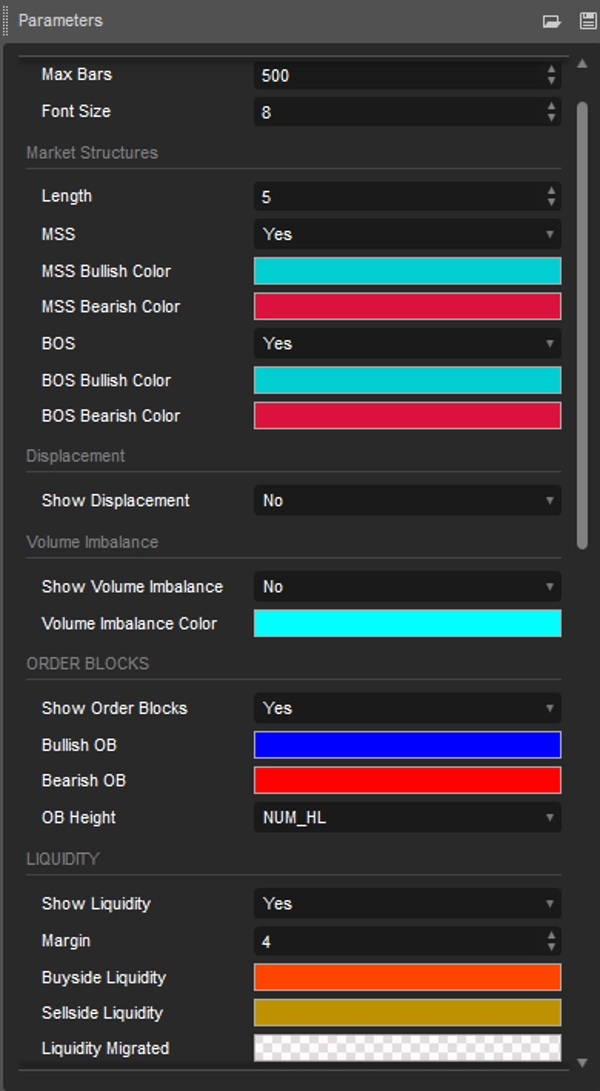
คุณสมบัติที่ปรับแต่งได้
ผู้ใช้สามารถปรับการตั้งค่า เช่น ความยาวข้อมูล, สี, และรูปแบบการแสดงผลให้ตรงกับความชอบในการเทรดของตน
ประโยชน์สำหรับเทรดเดอร์
ประหยัดเวลาการวิเคราะห์ด้วยตนเอง เพิ่มประสิทธิภาพการเทรด
ช่วยให้ตัดสินใจได้รวดเร็วและมีข้อมูลในช่วงตลาดผันผวน
ใช้งานง่ายสำหรับทั้งผู้เริ่มต้นและเทรดเดอร์ที่มีประสบการณ์
บทสรุป
ตัวชี้วัด Simple ICT Concepts ไม่ใช่แค่เครื่องมือ แต่เป็นโซลูชันครบวงจรสำหรับเทรดเดอร์ที่ต้องการใช้กลยุทธ์ ICT อย่างมีประสิทธิภาพ เป็นตัวเลือกที่แข็งแกร่งสำหรับการเพิ่มประสิทธิภาพการวิเคราะห์ตลาดและการดำเนินการเทรดที่แม่นยำ
สรุป
สรุปโดย AI
The Simple ICT Concepts Indicator is a technical analysis tool designed to assist traders in applying the Inner Circle Trader (ICT) methodology. It identifies key market zones including liquidity levels, support and resistance, and market structure to support price action and smart money concept trading. The indicator labels market structure shifts (MSS) and breaks of structure (BOS) based on swing point breaks, helping users determine current market trends. It detects displacements characterized by successive candles with strong directional sentiment, volume imbalances where candle bodies leave gaps, and order blocks representing institutional buy or sell zones. The tool highlights buy-side and sell-side liquidity levels, indicating where stop-loss and limit orders cluster. It also identifies fair value gaps (FVG), implied fair value gaps (IFVG), balanced price ranges, and new week/day opening gaps (NWOG/NDOG). Users can customize settings such as data length, colors, and display styles to fit their trading preferences. The indicator aims to save time on manual analysis and facilitate quick, informed decisions in volatile markets. It is suitable for both beginners and experienced traders seeking to implement ICT strategies effectively across markets including Forex, cryptocurrencies, and indices like BTCUSD, XAUUSD, and NAS100.
โปรไฟล์อินดิเคเตอร์
รีวิวจากลูกค้า
4.0
รีวิว: 1
5 | 0 % | |
4 | 100 % | |
3 | 0 % | |
2 | 0 % | |
1 | 0 % |
รีวิวจากลูกค้า
December 27, 2025
The signal still needs a chart check, no surprise there. One green trade proves nothing.
การสนทนา
คำถามที่พบบ่อย
BTCUSD
Forex
Signal
Fair Value Gap
Crypto
XAUUSD
NAS100
ผลิตภัณฑ์ที่มีให้บริการผ่าน cTrader Store รวมถึงบอทการเทรด อินดิเคเตอร์ และปลั๊กอิน มีให้บริการโดยนักพัฒนาบุคคลที่สามและมีไว้เพื่อวัตถุประสงค์ในการเข้าถึงข้อมูลและทางเทคนิคเท่านั้น cTrader Store ไม่ใช่โบรกเกอร์และไม่ได้ให้คำแนะนำการลงทุน คำแนะนำส่วนบุคคล หรือการรับประกันผลการดำเนินงานในอนาคต


ราคา
38
การขาย
2.39K
ติดตั้งฟรี