
MACD Indicator NDH
อินดิเคเตอร์
539 ดาวน์โหลด
เวอร์ชัน 1.0, Dec 2025
Windows, Mac
5.0
รีวิว: 3
คำอธิบาย
ตัวบ่งชี้ MACD
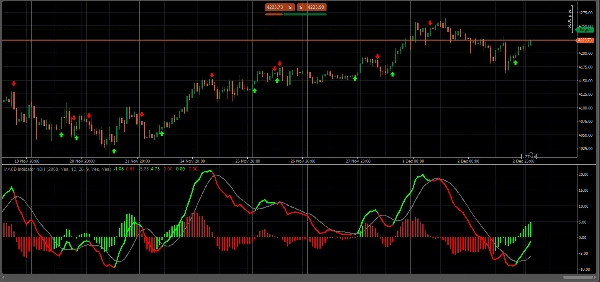
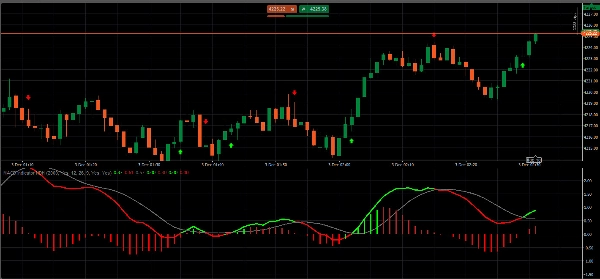
ประกอบด้วยเส้น MACD เส้นสัญญาณ และฮิสโตแกรม
ฮิสโตแกรมมี 4 สีขึ้นอยู่กับทิศทางเหนือและใต้เส้นศูนย์ แสดงทิศทางการเคลื่อนไหวอย่างง่ายที่สุด
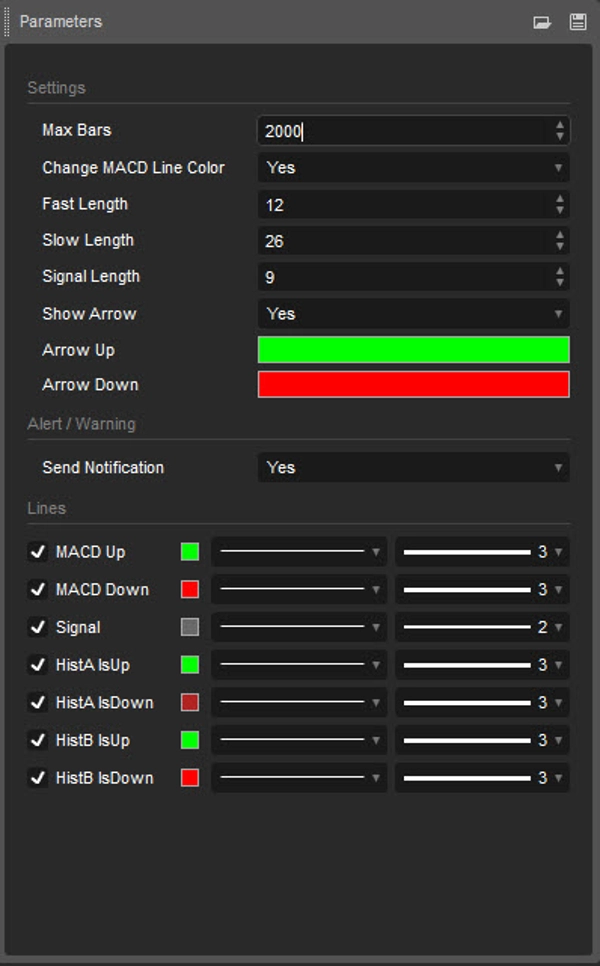
อนุญาตให้แสดงเส้น MACD & เส้นสัญญาณ แสดงการเปลี่ยนสีของเส้น MACD ตามการตัดกันของเส้นสัญญาณ
แสดงจุดที่เส้น MacD และเส้นสัญญาณตัดกัน เปิดและปิดฮิสโตแกรมได้
ขอให้สนุกกับประสบการณ์การเทรดของคุณ และอย่าลังเลที่จะแบ่งปันความคิดเห็นและรีวิวของคุณ
สรุป
สรุปโดย AI
The MACD Indicator NDH is a technical analysis tool featuring the MACD line, Signal line, and a multi-colored Histogram. The Histogram uses four distinct colors to represent directional movement above and below the zero line, simplifying trend visualization. Users can customize the display to show or hide the MACD and Signal lines, enable color changes on the MACD line based on its crossing with the Signal line, and toggle dots at these crossover points. The Histogram can also be turned on or off according to user preference. This indicator supports markets including Forex, Crypto (e.g., BTCUSD), and commodities such as XAUUSD, as well as indices like NAS100. It is designed to assist traders in identifying momentum and potential trade signals through clear visual cues.
โปรไฟล์อินดิเคเตอร์
รีวิวจากลูกค้า
5.0
รีวิว: 3
5 | 100 % | |
4 | 0 % | |
3 | 0 % | |
2 | 0 % | |
1 | 0 % |
รีวิวจากลูกค้า
April 28, 2026
After using MACD on my previous 2 platforms, finding this one on ctrader was very good. I'd like to edit the colour of the macd to suit my trading technique (when it moves up and down instead of when crossing the signal line), but it's still a very good indicator from this developer.
December 10, 2025
MACD NDH delivers a clean, modern take on the classic MACD. Smooth histogram, customizable EMAs, and clear momentum shifts make it great for intraday and swing use. Lightweight and stable. Alerts and divergence detection would make it even more powerful.
การสนทนา
คำถามที่พบบ่อย
BTCUSD
Forex
Signal
Crypto
XAUUSD
NAS100
MACD
ผลิตภัณฑ์ที่มีให้บริการผ่าน cTrader Store รวมถึงบอทการเทรด อินดิเคเตอร์ และปลั๊กอิน มีให้บริการโดยนักพัฒนาบุคคลที่สามและมีไว้เพื่อวัตถุประสงค์ในการเข้าถึงข้อมูลและทางเทคนิคเท่านั้น cTrader Store ไม่ใช่โบรกเกอร์และไม่ได้ให้คำแนะนำการลงทุน คำแนะนำส่วนบุคคล หรือการรับประกันผลการดำเนินงานในอนาคต


ราคา
38
การขาย
2.35K
ติดตั้งฟรี