
Fair Value Gaps
Indikator
1.02K downloads
Version 1.0, Dec 2025
Windows, Mac
5.0
Bewertungen: 1
Beschreibung
Fair Value Gap (FVG) Indikator
Überblick
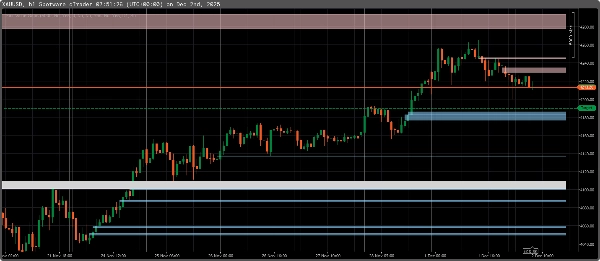
Der Fair Value Gap (FVG) Indikator identifiziert Ineffizienzen in der Kursbewegung, bei denen ein Ungleichgewicht durch aggressives Kaufen oder Verkaufen entsteht. Diese Lücken werden oft von institutionellen Händlern und Smart Money erzeugt und hinterlassen Bereiche, zu denen der Kurs später zurückkehren kann, um das Ungleichgewicht zu "füllen", bevor der Trend fortgesetzt wird.
Hauptmerkmale:
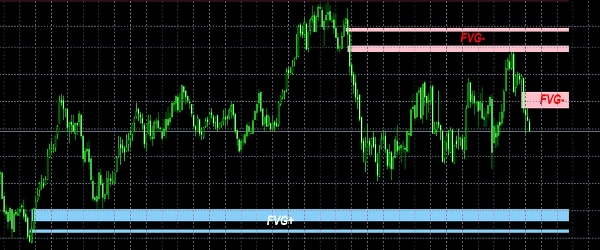
- Automatische Erkennung von FVGs – Der Indikator hebt Fair Value Gaps in verschiedenen Zeitrahmen hervor.
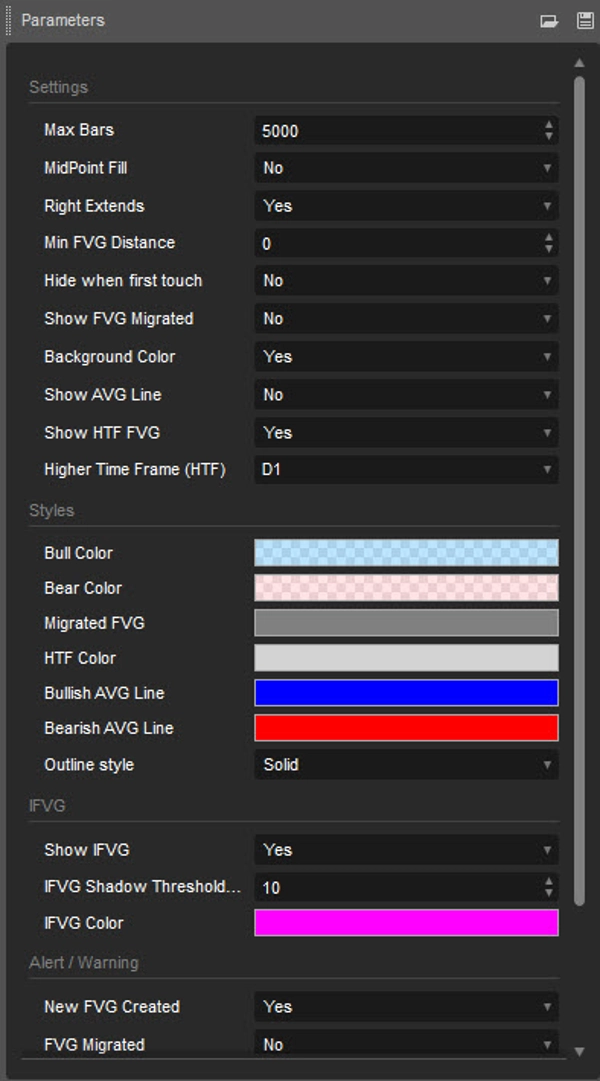
- Multi-Timeframe-Unterstützung – Anzeige von FVGs aus höheren Zeitrahmen in Charts mit niedrigeren Zeitrahmen.
Funktionsweise:
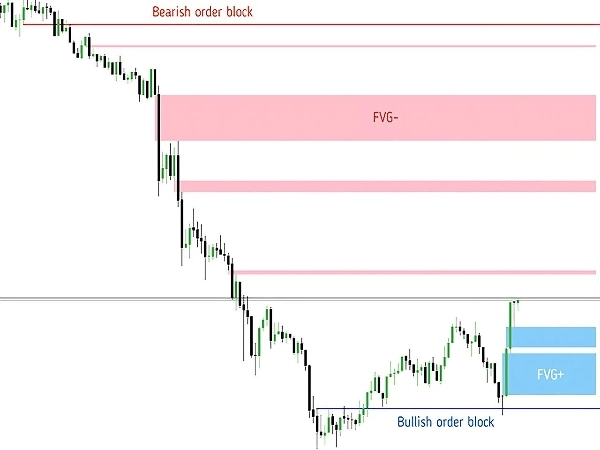
- Der Indikator scannt Kursbewegungen und erkennt Lücken, bei denen das Hoch einer Kerze nicht mit dem Tief von zwei Kerzen davor überlappt (bullishes FVG) oder umgekehrt (bärisches FVG).
- Diese Bereiche werden als potenzielle Liquiditätszonen markiert, die der Kurs vor der Fortsetzung des dominanten Trends erneut besuchen könnte.
- Der Indikator hilft Händlern, Smart Money Spurenzu erkennen, indem FVG mit BOS, CHoCH und Order Blocks kombiniert wird.
Handelsstrategie mit FVGs:
- Einstiegsstrategie: Warten Sie, bis der Kurs zur FVG-Zone zurückkehrt und darauf reagiert (Abprall, Unterstützung oder Widerstand).
- Kombinationshandel: Kombinieren Sie mit BOS, Order Blocks und Liquidity Sweeps für höhere Genauigkeit.
- Take-Profit-Ziele: Berücksichtigen Sie den nächsten Liquiditätspool oder das nächste wichtige Strukturlevel.
Für wen ist dieser Indikator geeignet?
- Smart Money & ICT Händler
- Price Action & institutionelle Händler
- Scalper & Swing Trader
Zusammenfassung
KI-Zusammenfassung
The Fair Value Gap (FVG) Indicator detects price action inefficiencies caused by aggressive buying or selling, often linked to institutional traders. It automatically identifies fair value gaps—areas where a candle’s high does not overlap with the low of two candles ahead (bullish FVG) or vice versa (bearish FVG)—across multiple timeframes, allowing users to view higher timeframe gaps on lower timeframe charts. These gaps represent potential liquidity zones where price may revisit before continuing its trend. The indicator helps traders recognize smart money footprints by combining FVG analysis with Break of Structure (BOS), Change of Character (CHoCH), and Order Blocks. Trading strategies using this indicator involve waiting for price reactions at FVG zones for entry, using confluence with other smart money concepts for accuracy, and targeting subsequent liquidity pools or major structure levels for take profit. It is suitable for smart money, ICT, price action, institutional traders, scalpers, and swing traders operating in markets including Forex, Crypto, and indices such as BTCUSD, EURUSD, XAUUSD, and NAS100.
Indikatorprofil
Kundenbewertungen
5.0
Bewertungen: 1
5 | 100 % | |
4 | 0 % | |
3 | 0 % | |
2 | 0 % | |
1 | 0 % |
Kundenbewertungen
December 10, 2025
A clean and accurate Fair Value Gap detector. Highlights bullish/bearish FVGs with minimal lag and great clarity. Useful for intraday and swing ICT/SMC setups. Can get busy on lower TFs, but filtering helps. Alerts, MTF mode and FVG state tracking would take it to the next level.
Diskussion
Häufig gestellte Fragen (FAQ)
BTCUSD
Forex
Scalping
EURUSD
Fair Value Gap
SMC
Crypto
XAUUSD
NAS100
Über den cTrader Store verfügbare Produkte, einschließlich Handelsbots, Indikatoren und Plugins, werden von externen Entwicklern bereitgestellt und nur zu Informations- und technischen Zugriffszwecken verfügbar gemacht. cTrader Store ist kein Broker und erbringt keine Anlageberatung, persönlichen Empfehlungen oder eine Garantie für zukünftige Performance.


Preis
38
Verkäufe
2.35K
Kostenlose Installationen