
Simple ICT Concepts
Indicateur
3 achats
Version 1.0, Dec 2025
Windows, Mac
4.0
Avis : 1
Description
L'Indicateur Simple ICT Concepts est un outil puissant conçu pour aider les traders à appliquer les principes de la méthodologie Inner Circle Trader (ICT). Cet indicateur se concentre sur l'identification des zones clés telles que les niveaux de liquidité, les supports et résistances, ainsi que la structure du marché, ce qui en fait un atout inestimable pour les traders axés sur l'action des prix et les concepts de smart money.
Caractéristiques principales
Structure du marché :
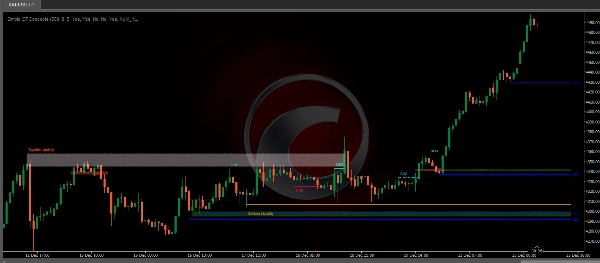
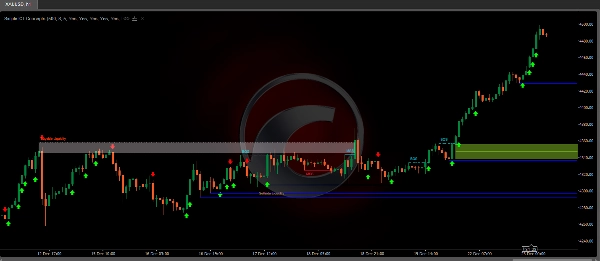
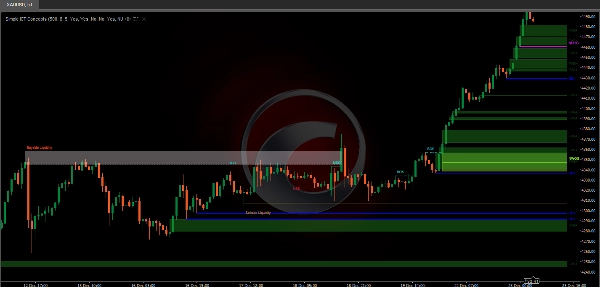
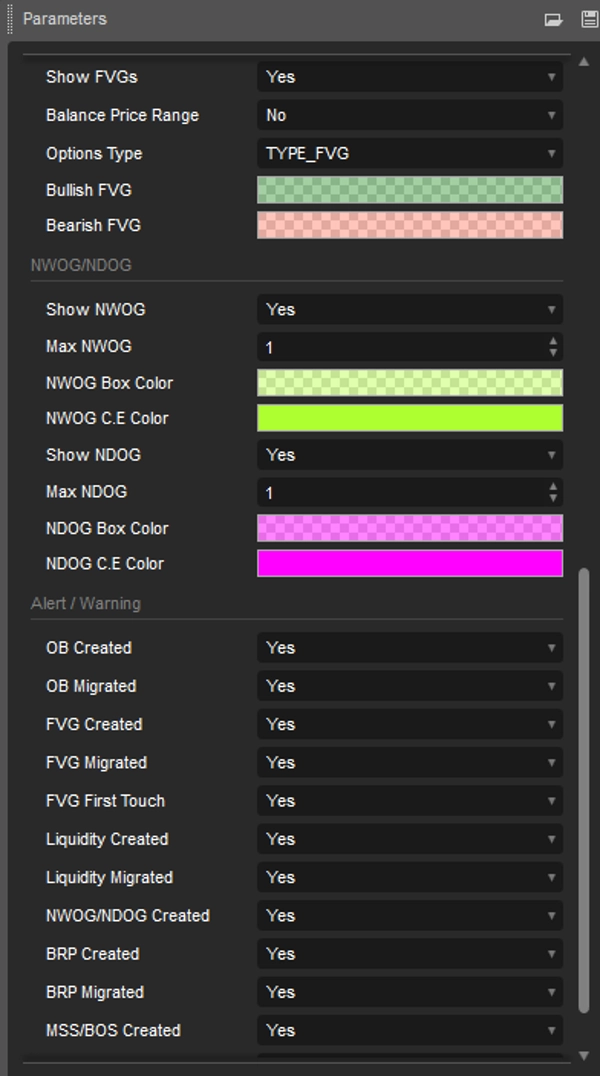
Les étiquettes de structure du marché sont construites à partir du franchissement par le prix d'un point de retournement précédent. Cela permet à l'utilisateur de déterminer la tendance actuelle du marché en fonction de l'action des prix.Il existe deux types d'étiquettes de structure du marché inclus :Changement de structure du marché (MSS)Rupture de structure (BOS)Un MSS se produit lorsque le prix casse un creux dans une tendance haussière ou un sommet dans une tendance baissière, mettant en évidence un renversement potentiel.Cela est souvent étiqueté comme "CHoCH", mais ICT le spécifie comme MSS. En revanche, les étiquettes BOS apparaissent lorsque le prix casse un sommet dans une tendance haussière ou un creux dans une tendance baissière.L'apparition de ces points de retournement particuliers est causée par des retracements (inducements) qui mettent en évidence la chasse à la liquidité sur des unités de temps inférieures.Points de retournement clés : Sommets plus hauts (HH) et creux plus bas (LL), creux plus hauts (HL) et sommets plus bas (LH)Déplacement :Les déplacements sont des scénarios où le prix forme des chandeliers successifs du même sentiment (haussier/baissier) avec de grands corps et de courtes ombres.Ils peuvent être identifiés plus techniquement par une autocorrélation positive (un changement de clôture à ouverture est plus susceptible d'être suivi par un changement du même signe) ainsi que par un regroupement de volatilité (les grands changements sont suivis de grands changements).Les déplacements peuvent être la cause de la formation de déséquilibres ainsi que de la structure du marché, ceux-ci pouvant être causés par l'exécution complète d'un méta-ordre.Déséquilibre de volume :Un déséquilibre de volume (V.I.) se produit lorsqu'il existe une zone de prix laissée sans corps de chandelier. Il y a un mouvement de va-et-vient dans le chevauchement des mèches, cependant, puisque la majeure partie du volume se trouve dans le corps du chandelier, nous appelons cela un déséquilibre de volume.Blocs d'ordres :Un bloc d'ordres ICT (Inner Circle Trader) est une zone de prix sur un graphique où de grands investisseurs institutionnels placent des ordres d'achat ou de vente importants. Les blocs d'ordres sont un concept clé en trading, car ils peuvent aider les traders à identifier des niveaux potentiels de support et de résistance, et anticiper les renversements de prix.Liquidité :Les niveaux de liquidité côté achat/côté vente mettent en évidence les niveaux de prix où les participants au marché pourraient placer des ordres limite/stop.Les niveaux de liquidité côté achat regrouperont les ordres stop-loss des traders shorts ainsi que les ordres limite des traders longs, tandis que les niveaux de liquidité côté vente regrouperont les ordres stop-loss des traders longs ainsi que les ordres limite des traders shorts.Ces niveaux peuvent jouer différents rôles. Les participants au marché mieux informés peuvent considérer ces niveaux comme une source de liquidité, et une fois que la liquidité au-dessus d'un niveau spécifique est réduite, elle sera trouvée dans une autre zone.FVG/IFVG :Fair Value Gaps : Une formation de trois chandeliers où les ombres des chandeliers adjacents au chandelier central ne se chevauchent pas, ce qui met en évidence une zone de gap.Implied Fair Value Gaps : Contrairement au fair value gap, l'implied fair value gap a des ombres de chandeliers adjacentes au chandelier central qui se chevauchent. La zone de gap est construite à partir de la moyenne entre l'ombre respective et l'extrémité la plus proche du corps de leur chandelier.Plage de prix équilibrée : Les plages de prix équilibrées se produisent lorsqu'un fair value gap chevauche un fair value gap précédent, la zone de chevauchement résultant dans la zone de déséquilibre.NWOG/NDOG :Cet indicateur révèle les gaps d'ouverture de nouvelle semaine (NWOG) et les gaps d'ouverture de nouveau jour (NDOG). Le NWOG est le gap entre le prix de clôture du vendredi et le prix d'ouverture du dimanche. Le NDOG est le gap entre le prix d'ouverture et le prix de clôture du jour précédent.
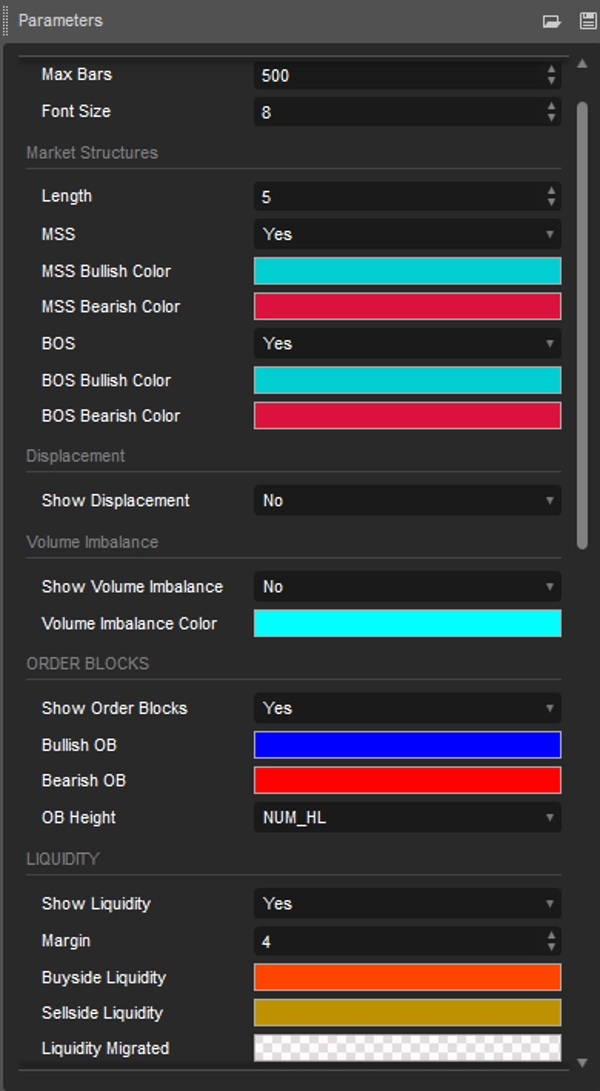
Fonctionnalités personnalisables
Les utilisateurs peuvent ajuster des paramètres tels que la longueur des données, les couleurs et les styles d'affichage pour correspondre à leurs préférences de trading.
Avantages pour les traders
Gagne du temps sur l'analyse manuelle, améliorant l'efficacité du trading.
Aide à prendre des décisions rapides et éclairées lors de conditions de marché volatiles.
Facile à utiliser pour les débutants comme pour les traders expérimentés.
Conclusion
L'indicateur Simple ICT Concepts n'est pas seulement un outil mais une solution complète pour les traders cherchant à mettre en œuvre efficacement les stratégies ICT. C'est un choix robuste pour améliorer l'analyse du marché et exécuter des trades précis.
Résumé
Résumé IA
The Simple ICT Concepts Indicator is a technical analysis tool designed to assist traders in applying the Inner Circle Trader (ICT) methodology. It identifies key market zones including liquidity levels, support and resistance, and market structure to support price action and smart money concept trading. The indicator labels market structure shifts (MSS) and breaks of structure (BOS) based on swing point breaks, helping users determine current market trends. It detects displacements characterized by successive candles with strong directional sentiment, volume imbalances where candle bodies leave gaps, and order blocks representing institutional buy or sell zones. The tool highlights buy-side and sell-side liquidity levels, indicating where stop-loss and limit orders cluster. It also identifies fair value gaps (FVG), implied fair value gaps (IFVG), balanced price ranges, and new week/day opening gaps (NWOG/NDOG). Users can customize settings such as data length, colors, and display styles to fit their trading preferences. The indicator aims to save time on manual analysis and facilitate quick, informed decisions in volatile markets. It is suitable for both beginners and experienced traders seeking to implement ICT strategies effectively across markets including Forex, cryptocurrencies, and indices like BTCUSD, XAUUSD, and NAS100.
Profil de l'indicateur
Avis clients
4.0
Avis : 1
5 | 0 % | |
4 | 100 % | |
3 | 0 % | |
2 | 0 % | |
1 | 0 % |
Avis clients
December 27, 2025
The signal still needs a chart check, no surprise there. One green trade proves nothing.
Discussion
Questions fréquentes
BTCUSD
Forex
Signal
Fair Value Gap
Crypto
XAUUSD
NAS100
Les produits disponibles sur cTrader Store, notamment les bots de trading, les indicateurs et les plug-ins, sont fournis par des développeurs tiers et mis à disposition à titre informatif et à des fins d'accès technique uniquement. cTrader Store n'est pas un courtier et ne fournit aucun conseil en investissement, aucune recommandation personnelle ni aucune garantie quant aux performances futures.


![Logo de "[Hamster-Coder] Moving Average MTF"](https://cdn.ctrader.com/image/webp/b11b98b1-194d-4b8e-b00e-d611826ad159_31226)


Prix
38
Ventes
2.39K
Installations gratuites