
Sero
Indikator
105 downloads
Version 1.0, Mar 2026
Windows, Mac
Beschreibung
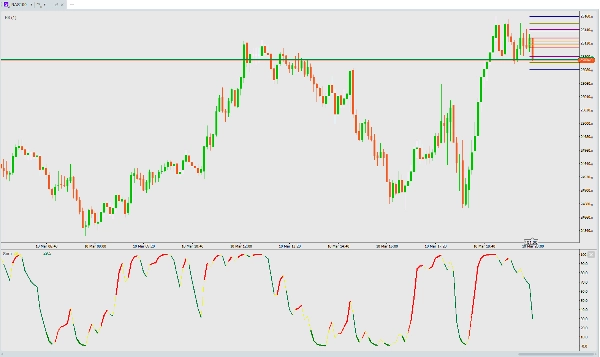
Sero — Momentum Oszillator
Sero ist ein stochastisch basierter Momentum-Oszillator, der klare, farbcodierte visuelle Signale für Marktmomentumverschiebungen liefert.
Wie es funktioniert
Sero berechnet einen geglätteten stochastischen Wert aus dem Typical Price (Hoch+Tief+Schluss)/3 über einen 15-Bar-Bereich und wendet dann eine schnelle 2-Perioden-EMA an, um einen reaktionsschnellen 0–100 Oszillator zu erzeugen.
Worauf man achten sollte
Farben erzählen die Geschichte:
- Gelbe Linie — der Basis-Sero-Wert (immer sichtbar)
- Rote Linie — bullisches Momentum (Sero steigt)
- Dicke rote Linie — starkes bullisches Momentum (steigend + über 20 — bestätigt Ausbruch aus überverkauft)
- Grüne Linie — bärisches Momentum (Sero fällt)
- Dicke grüne Linie — starker bärischer Einbruch (fallend + unter 20 — tief im überverkauften Bereich)
Wichtige Signale:
- Kaufsignal — Farbwechsel von Grün zu Rot, besonders von unter 20 (Überverkauft-Umkehr)
- Verkaufssignal — Farbwechsel von Rot zu Grün, besonders von über 80 (Überkauft-Umkehr)
- Starker Trend — Dicke Linien bestätigen die Momentum-Überzeugung
- Erschöpfung — Dickes Grün unter 20 = Verkäufer könnten die Kraft ausgehen, auf Umkehr achten
Beste Praktiken
- Funktioniert auf jedem Zeitrahmen und jedem Instrument
- Mit Preisaktion oder Unterstützungs-/Widerstandsniveaus zur Bestätigung kombinieren
- Farbwechsel nahe Extremen (0 oder 100) sind die Signale mit der höchsten Wahrscheinlichkeit
- Keine Einstellungen erforderlich — optimiert und sofort einsatzbereit
Zusammenfassung
KI-Zusammenfassung
Sero is a stochastic-based momentum oscillator designed to identify market momentum shifts through clear, color-coded visual signals. It calculates a smoothed stochastic value from the Typical Price [(High + Low + Close) / 3] over a 15-bar range, then applies a fast 2-period exponential moving average (EMA) to generate a responsive oscillator ranging from 0 to 100.
The indicator displays multiple colored lines to represent momentum states:
- Yellow line: base Sero value (always visible)
- Red line: bullish momentum (rising oscillator)
- Thick red line: strong bullish momentum (rising and above 20, indicating breakout from oversold)
- Green line: bearish momentum (falling oscillator)
- Thick green line: strong bearish momentum (falling and below 20, indicating deep oversold conditions)
Key signals include buy signals when the color flips from green to red, especially below 20 (oversold reversal), and sell signals when it flips from red to green, especially above 80 (overbought reversal). Thick lines confirm strong momentum trends, while thick green lines below 20 may indicate exhaustion of selling pressure and potential reversal.
Sero works on any timeframe and instrument without requiring user settings, and it is recommended to combine it with price action or support/resistance levels for confirmation. Color transitions near extremes (0 or 100) provide the highest-probability signals.
Indikatorprofil
Kundenbewertungen
0.0
Bewertungen: 0
Kundenbewertungen
Bisher gibt es keine Bewertungen für dieses Produkt. Haben Sie es schon ausprobiert? Dann können Sie die erste Person sein, die andere darüber informiert!
Diskussion
Häufig gestellte Fragen (FAQ)
BTCUSD
Forex
Signal
Indices
EURUSD
Commodities
GBPUSD
NZDUSD
Crypto
Stocks
XAUUSD
NAS100
USDJPY
Über den cTrader Store verfügbare Produkte, einschließlich Handelsbots, Indikatoren und Plugins, werden von externen Entwicklern bereitgestellt und nur zu Informations- und technischen Zugriffszwecken verfügbar gemacht. cTrader Store ist kein Broker und erbringt keine Anlageberatung, persönlichen Empfehlungen oder eine Garantie für zukünftige Performance.
Mehr von diesem Autor


Preis
Seit 10/03/2026
105
Kostenlose Installationen