
Beschreibung
SR COMMANDER — Multi Timeframe Edition
Sehen Sie, wo das große Geld die Linie zieht. Handeln Sie in Ihrem Zeitrahmen. Denken Sie in ihrem.
Die meisten Unterstützungs- und Widerstandswerkzeuge sind an den Zeitrahmen Ihres Charts gebunden. Wenn Sie auf M1 scalpen, stammen Ihre S/R-Niveaus von M1-Kerzen – klein, laut und leicht zu fälschen. SR Commander MTF durchbricht diese Kette.
Stellen Sie Ihren Chart auf M1 ein. Stellen Sie Ihren SR-Zeitrahmen auf H1 ein. Jetzt scalpen Sie mit der Präzision eines Ein-Minuten-Charts, aber Ihre Unterstützungs- und Widerstandsniveaus werden aus den Stundenkerzen gezogen, in denen Institutionen, Algorithmen und professionelle Trader tatsächlich ihre Entscheidungen treffen. Das ist der Vorteil.
WIE DIE MULTI TIMEFRAME-ENGINE FUNKTIONIERT
Der Indikator läuft gleichzeitig mit zwei unabhängigen Datenströmen.
Ihr Chart-Zeitrahmen steuert, was Sie sehen – Ihre Kerzen, Ihre Einstiege, Ihre Pfeile, Ihr Timing. Ihr SR-Zeitrahmen steuert, woher die Niveaus stammen. Diese beiden Ströme werden in Echtzeit, Balken für Balken, aufeinander abgebildet. Wenn eine neue Chartkerze schließt, sucht SR Commander die korrekte SR-Zeitrahmenkerze für diesen genauen Moment und berechnet die Niveaus aus der Struktur des höheren Zeitrahmens neu.
Das bedeutet, dass Ihre grüne Unterstützungs- und rote Widerstandslinie immer die volatilitätsgewichtete Struktur des von Ihnen gewählten SR-Zeitrahmens widerspiegeln – nicht das Rauschen des Charts, den Sie beobachten.
DIE WISSENSCHAFT HINTER DEN NIVEAUS
SR Commander zeichnet nicht nur Linien an Swing-Hochs und -Tiefs. Es verwendet ein Yang-Zhang-Volatilitätsmodell – dieselbe Klasse von Volatilitätsschätzern, die in professioneller quantitativer Forschung verwendet wird – um das wahre statistische Gewicht jeder Kerze zu berechnen. Jedes Niveau wird aus der normalisierten Preisstruktur abgeleitet und berücksichtigt Übernacht-Gaps, Open-to-Close-Bewegungen und Intrabar-Spannen. Das Ergebnis sind Niveaus mit echter mathematischer Bedeutung, nicht nur visueller Hervorhebung.
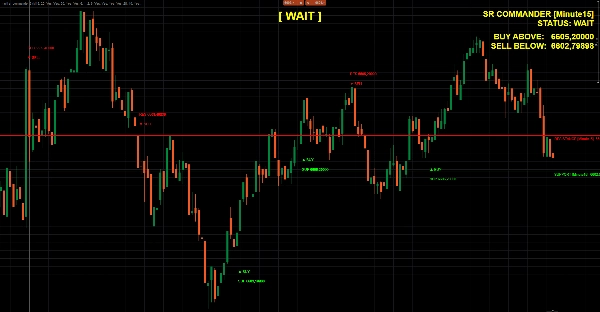
WAS SIE IM CHART SEHEN
- 🟢 Grüne Unterstützungslinie – der nächstgelegene statistisch signifikante Boden unter dem aktuellen Preis, basierend auf Ihrem gewählten SR-Zeitrahmen
- 🔴 Rote Widerstandslinie – die nächstgelegene statistisch signifikante Decke über dem aktuellen Preis, basierend auf Ihrem gewählten SR-Zeitrahmen
- ⬆️ KAUF-Signal – wird ausgelöst, wenn der Preis von der Unterstützung abprallt mit einem bestätigten bullischen Schluss auf der SR-Zeitrahmenkerze
- ⬇️ VERKAUF-Signal – wird ausgelöst, wenn der Preis den Widerstand ablehnt mit einem bestätigten bärischen Schluss auf der SR-Zeitrahmenkerze
- 📊 Live-Dashboard – zeigt aktiven SR-Zeitrahmen, aktuellen Status und genaue Ausbruch-Trigger-Preise
- 🔵 Großes Status-Label – KAUF / VERKAUF / WARTEN, wird bei jedem Balken oben in der Mitte Ihres Charts aktualisiert
- 🕓 Historische Überlagerung – Abpraller, Ablehnungen, Ausbrüche und Zusammenbrüche auf dem Chart markiert für sofortige visuelle Validierung
ZEITRAHMEN-KOMBINATIONEN, DIE FUNKTIONIEREN
Chart TFSR-ZeitrahmenAnwendungsfall
M1
M5 oder M15
Schnelles Scalping mit kurzfristiger Struktur
M5
H1
Intraday-Handel mit stündlichen Niveaus
M15
H4
Swing-Einstiege mit 4-Stunden-Struktur
H1
D1
Positionshandel basierend auf täglichem S/R
Beliebig
Chart
Klassischer Modus – ursprüngliches Einzel-Zeitrahmen-Verhalten
FUNKTIONEN
- Vollständige Multi-Timeframe-Engine – jeder SR-Zeitrahmen auf jedem Chart-Zeitrahmen
- Yang-Zhang volatilitätsnormalisierte Niveau-Berechnung
- Einbeziehung der größten Kerze – erfasst immer die dominante Strukturkerze des Rückblickzeitraums
- Abprall- und Ablehnungssignal-Logik mit konfigurierbarer Toleranz und Puffer
- Ausbruch- und Zusammenbruchserkennung mit einstellbarem Puffer
- Historische Signalüberlagerung für sofortige chartbasierte Validierung
- Dashboard und großes Status-Label mit vollständig anpassbaren Schriftgrößen und Farben
- Kein Nachzeichnen – alle Signale basieren auf geschlossenen Kerzen, wenn der Bestätigungsmodus aktiv ist
FÜR WEN IST DAS?
Trader, die verstehen, dass die besten Einstiege auf niedrigeren Zeitrahmen stattfinden, aber die besten Niveaus auf höheren. Wenn Sie jemals H4-Niveaus von Hand gezeichnet haben, während Sie M5 gehandelt haben – automatisiert SR Commander diesen gesamten Prozess, hält ihn mathematisch fundiert und zeigt das Signal direkt auf Ihrem Chart, sobald der Preis reagiert.
Höhere Zeitrahmen-Struktur. Niedrigere Zeitrahmen-Präzision. Ein Indikator.
Zusammenfassung
The indicator calculates S/R levels using the Yang-Zhang volatility model, which accounts for overnight gaps, open-to-close movement, and intrabar range to produce statistically significant levels rather than simple swing highs and lows. On the chart, it shows a green support line and a red resistance line representing the nearest significant levels below and above the current price from the chosen S/R timeframe.
Additional features include buy and sell signals triggered by price reactions to these levels confirmed on the S/R timeframe, a live dashboard displaying current status and breakout prices, a large status label indicating BUY, SELL, or WAIT, and historical overlays marking past bounces, rejections, and breakouts. The indicator supports various timeframe combinations suitable for scalping, intraday, swing, and position trading across markets including forex, indices, commodities, stocks, and crypto.
Kundenbewertungen
5 | 50 % | |
4 | 50 % | |
3 | 0 % | |
2 | 0 % | |
1 | 0 % |


