
MACD x Volume Profile
Indikator
Version 1.0, Jul 2026
Windows, Mac
Seit 21/02/2026
17.43M
Gehandeltes Volumen
2.85K
Pip-Gewinn
1
Verkäufe
Beschreibung
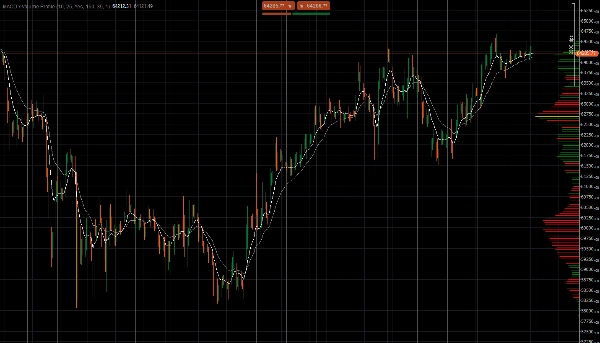
Der MACD x Volume Profile ist ein benutzerdefinierter cTrader (cAlgo) Overlay-Indikator, der Tradern eine doppelte Perspektive auf Markttrends und Liquidität bietet. Durch die Kombination der grundlegenden Elemente des MACD-Indikators mit einem dynamischen Volume Profile ermöglicht er es den Nutzern, Momentum zusammen mit historischen Preisakzeptanzzonen direkt im Hauptchart zu analysieren.
Hauptmerkmale:
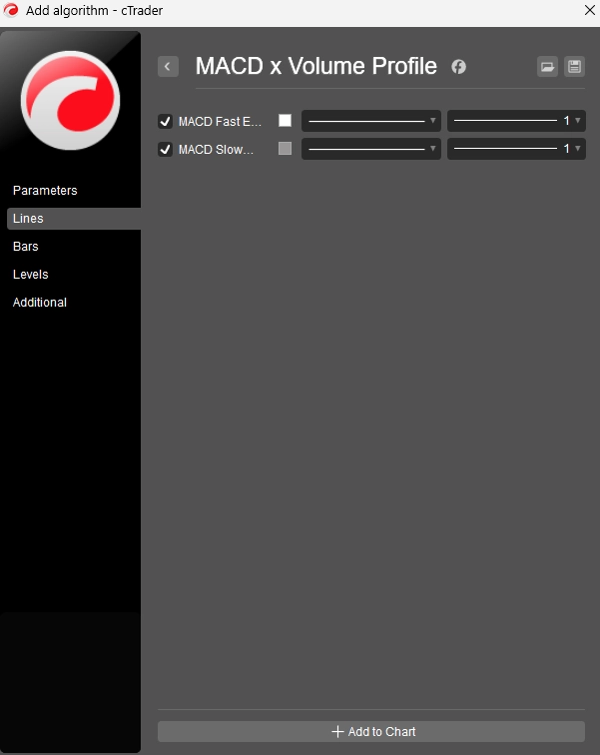
- Duale exponentielle gleitende Durchschnitte (EMAs): Zeigt einen schnellen EMA (Standard 10) und einen langsamen EMA (Standard 25) direkt im Preischart an. Das Kreuzen und Auseinanderlaufen dieser Linien hilft, die kurzfristige und langfristige Trendrichtung sowie das Momentum zu erkennen und bildet die Grundlage der standardmäßigen MACD-Analyse.
- Dynamisches Volume Profile des sichtbaren Bereichs (VRVP): Der Indikator berechnet und zeichnet dynamisch ein Volume Profile basierend nur auf den aktuell sichtbaren Balken in Ihrem Chart. Es wird automatisch neu berechnet und angepasst, wann immer Sie scrollen, zoomen oder das Chartfenster ändern.
- Hervorhebung des Point of Control (POC): Das Preisniveau mit dem höchsten gehandelten Volumen (der POC) wird deutlich mit einer dickeren gelben Linie hervorgehoben, sodass Sie sofort den stärksten Unterstützungs- oder Widerstandsbereich in Ihrer aktuellen Ansicht erkennen können.
- Richtungsabhängige Volumenfärbung: Die Volumenlinien sind farblich codiert, um Kauf- oder Verkaufsdruck anzuzeigen. Wenn ein Preisbereich während bullischer Kerzen (Close ≥ Open) mehr Volumen aufwies, färbt sich die Profilinie grün. Bei dominierendem bärischem Volumen färbt sich die Linie rot.
Parameteranpassung:
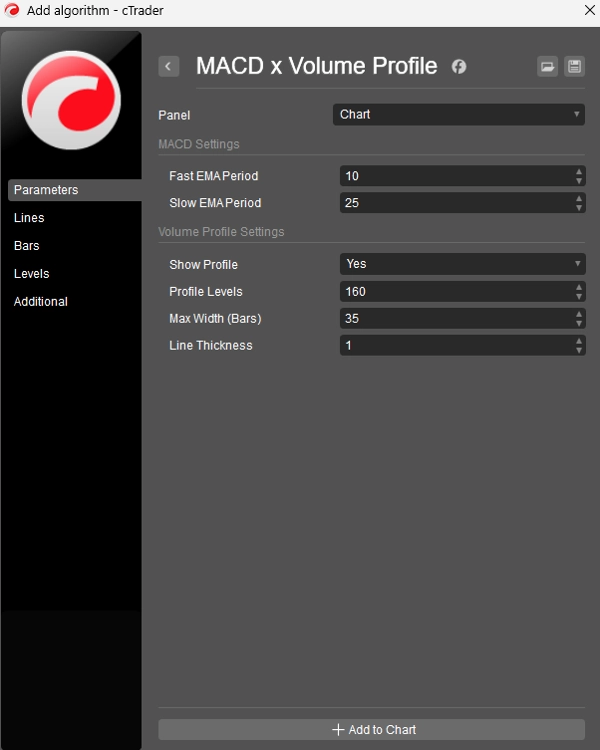
- MACD-Einstellungen: Vollständig anpassbare Perioden für sowohl den schnellen als auch den langsamen EMA.
- Profilgranularität: Der Parameter für die Profilebenen ermöglicht es Ihnen, die Auflösung des Volume Profiles (von 10 bis zu 200 Preisabschnitten) anzupassen.
- Visuelle Anpassungen: Nutzer können die Sichtbarkeit des Profils umschalten, die maximale Breite auf dem Bildschirm skalieren und die Linienstärke anpassen, um das Chart sauber und an ihre visuellen Vorlieben angepasst zu halten.
Zusammenfassung
AI summary
The MACD x Volume Profile is a cTrader (cAlgo) overlay indicator that integrates the MACD's Fast and Slow Exponential Moving Averages (EMAs) with a dynamic Volume Profile on the main price chart. It displays a Fast EMA (default 10) and Slow EMA (default 25) to help identify trend direction and momentum through their crossings and separations. The Volume Profile dynamically calculates volume distribution based on the currently visible bars, updating automatically with chart navigation. The indicator highlights the Point of Control (POC)—the price level with the highest traded volume—using a distinct yellow line to mark key support or resistance zones. Volume bars are color-coded green or red to indicate buying or selling pressure, respectively. Users can customize MACD periods, adjust the granularity of the volume profile (10 to 200 price buckets), and modify visual settings such as profile visibility, width, and line thickness to suit their preferences. This tool combines momentum analysis with liquidity visualization to support trading decisions.
Indikatorprofil
Indikatorkategorie
Volumen
Ausgabetyp
Visualisierung
Datenanforderungen
Volumen
Unterstützte Signale
Trendstärke
Kundenbewertungen
0.0
Bewertungen: 0
Kundenbewertungen
Bisher gibt es keine Bewertungen für dieses Produkt. Haben Sie es schon ausprobiert? Dann können Sie die erste Person sein, die andere darüber informiert!
Diskussion
Häufig gestellte Fragen (FAQ)
EMA
Volume
MACD
Moving Average
Über den cTrader Store verfügbare Produkte, einschließlich Handelsbots, Indikatoren und Plugins, werden von externen Entwicklern bereitgestellt und nur zu Informations- und technischen Zugriffszwecken verfügbar gemacht. cTrader Store ist kein Broker und erbringt keine Anlageberatung, persönlichen Empfehlungen oder eine Garantie für zukünftige Performance.
Mehr von diesem Autor






















Preis
Seit 21/02/2026
17.43M
Gehandeltes Volumen
2.85K
Pip-Gewinn
1
Verkäufe